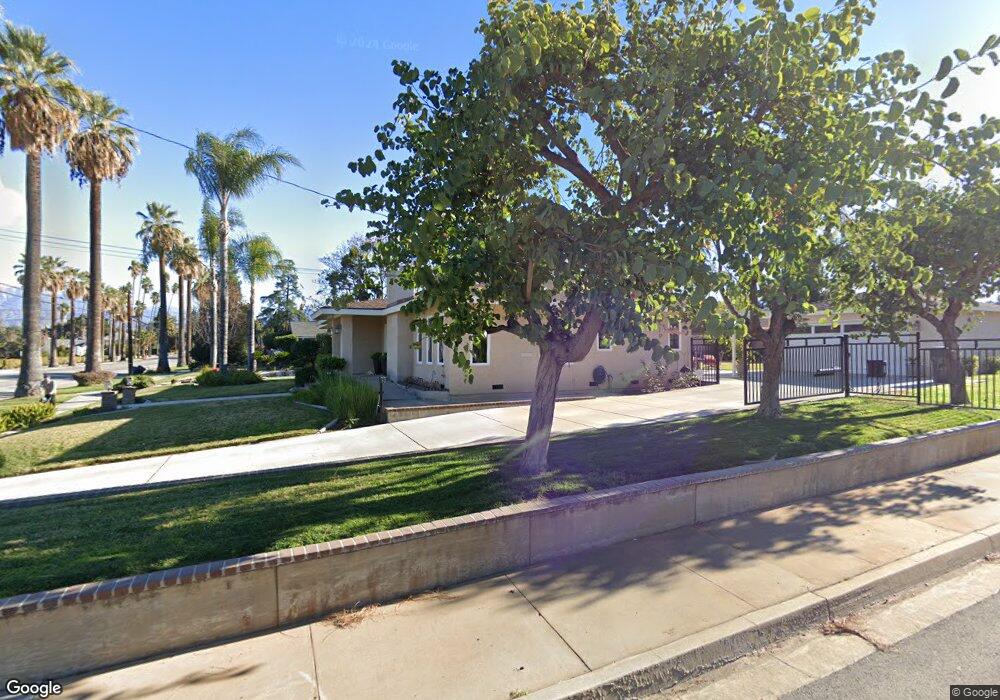
921 W Olive Ave Redlands, CA 92373
South Redlands NeighborhoodEstimated Value: $665,808 - $744,000
4
Beds
2
Baths
2,418
Sq Ft
$294/Sq Ft
Est. Value
About This Home
This home is located at 921 W Olive Ave, Redlands, CA 92373 and is currently estimated at $710,452, approximately $293 per square foot. 921 W Olive Ave is a home located in San Bernardino County with nearby schools including McKinley Elementary School, Cope Middle School, and Redlands Senior High School.
Ownership History
Date
Name
Owned For
Owner Type
Purchase Details
Closed on
Sep 28, 2020
Sold by
Hemme Michelle R
Bought by
Hemme Michelle R and The 2020 Michelle Hemme Revoca
Current Estimated Value
Purchase Details
Closed on
Sep 14, 1999
Sold by
Hemme Kiel Tr and Hemme Karen F Tr
Bought by
Hemme Michelle
Home Financials for this Owner
Home Financials are based on the most recent Mortgage that was taken out on this home.
Original Mortgage
$70,000
Interest Rate
7.89%
Mortgage Type
Seller Take Back
Create a Home Valuation Report for This Property
The Home Valuation Report is an in-depth analysis detailing your home's value as well as a comparison with similar homes in the area
Home Values in the Area
Average Home Value in this Area
Purchase History
| Date | Buyer | Sale Price | Title Company |
|---|---|---|---|
| Hemme Michelle R | -- | None Available | |
| Hemme Michelle | -- | -- |
Source: Public Records
Mortgage History
| Date | Status | Borrower | Loan Amount |
|---|---|---|---|
| Closed | Hemme Michelle | $70,000 |
Source: Public Records
Tax History
| Year | Tax Paid | Tax Assessment Tax Assessment Total Assessment is a certain percentage of the fair market value that is determined by local assessors to be the total taxable value of land and additions on the property. | Land | Improvement |
|---|---|---|---|---|
| 2025 | $2,586 | $212,878 | $49,785 | $163,093 |
| 2024 | $2,415 | $208,704 | $48,809 | $159,895 |
| 2023 | $2,411 | $204,612 | $47,852 | $156,760 |
| 2022 | $2,374 | $200,600 | $46,914 | $153,686 |
| 2021 | $2,416 | $196,667 | $45,994 | $150,673 |
| 2020 | $2,379 | $194,650 | $45,522 | $149,128 |
| 2019 | $2,312 | $190,833 | $44,629 | $146,204 |
| 2018 | $2,253 | $187,091 | $43,754 | $143,337 |
| 2017 | $2,232 | $183,422 | $42,896 | $140,526 |
| 2016 | $2,206 | $179,826 | $42,055 | $137,771 |
| 2015 | $2,188 | $177,125 | $41,423 | $135,702 |
| 2014 | $2,147 | $173,656 | $40,612 | $133,044 |
Source: Public Records
Map
Nearby Homes
- 975 Brookside Ave
- 215 San Rafael St
- 608 Linda Place
- 108 S Buena Vista St
- 616 Monterey St
- 122 Tamarisk St
- 979 Kevin Ave
- 48 N Center St
- 622 Esther Way
- 1324 W Fern Ave
- 1235 W Cypress Ave
- 316 S 4th St
- 163 N Center St
- 167 N Center St
- 726 Robinhood Ln
- 1029 W Palm Ave
- 1033 W Palm Ave
- 1421 Magnolia Ave
- 171 Bellevue Ave
- 509 S 4th St
Your Personal Tour Guide
Ask me questions while you tour the home.