921 W Olive Ave Redlands, CA 92373
South Redlands NeighborhoodEstimated Value: $694,351 - $775,000
About This Home
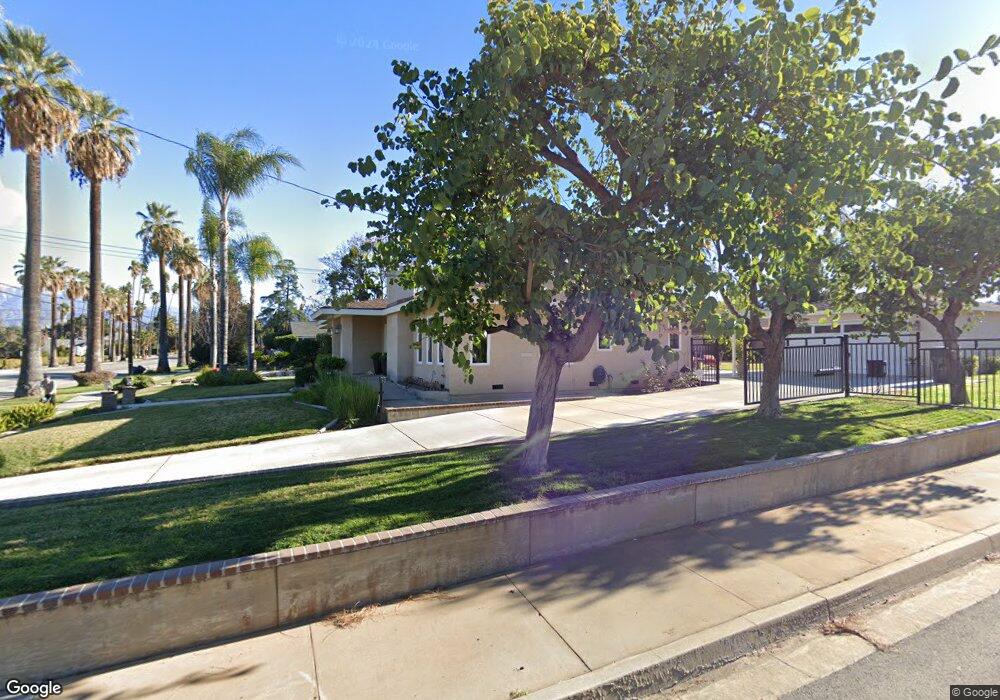
This home is located at 921 W Olive Ave, Redlands, CA 92373 and is currently estimated at $732,088, approximately $302 per square foot. 921 W Olive Ave is a home located in San Bernardino County with nearby schools including McKinley Elementary School, Cope Middle School, and Redlands Senior High School.
Ownership History
We collect this data history from publicly available records. To have your information removed, we recommend requesting removal directly through your county’s website.
Purchase Details
Purchase Details
Home Financials for this Owner
Home Financials are based on the most recent Mortgage that was taken out on this home.Home Values in the Area
Average Home Value in this Area
Purchase History
We collect this data history from publicly available records. To have your information removed, we recommend requesting removal directly through your county’s website.
| Date | Buyer | Sale Price | Title Company |
|---|---|---|---|
| -- | None Available | ||
| -- | -- |
Mortgage History
We collect this data history from publicly available records. To have your information removed, we recommend requesting removal directly through your county’s website.
| Date | Status | Borrower | Loan Amount |
|---|---|---|---|
| Closed | $70,000 |
Tax History
We collect this data history from publicly available records. To have your information removed, we recommend requesting removal directly through your county’s website.
| Year | Tax Paid | Tax Assessment Tax Assessment Total Assessment is a certain percentage of the fair market value that is determined by local assessors to be the total taxable value of land and additions on the property. | Land | Improvement |
|---|---|---|---|---|
| 2025 | $2,586 | $212,878 | $49,785 | $163,093 |
| 2024 | $2,415 | $208,704 | $48,809 | $159,895 |
| 2023 | $2,411 | $204,612 | $47,852 | $156,760 |
| 2022 | $2,374 | $200,600 | $46,914 | $153,686 |
| 2021 | $2,416 | $196,667 | $45,994 | $150,673 |
| 2020 | $2,379 | $194,650 | $45,522 | $149,128 |
| 2019 | $2,312 | $190,833 | $44,629 | $146,204 |
| 2018 | $2,253 | $187,091 | $43,754 | $143,337 |
| 2017 | $2,232 | $183,422 | $42,896 | $140,526 |
| 2016 | $2,206 | $179,826 | $42,055 | $137,771 |
| 2015 | $2,188 | $177,125 | $41,423 | $135,702 |
| 2014 | $2,147 | $173,656 | $40,612 | $133,044 |
Map
- 115 Dale Ln
- 25 Dale Ln
- 306 S Center St
- 1027 Fletcher Ave
- 102 N Center St
- 8 Dale Ln
- 107 S Center St
- 351 Sherwood St
- 32 N San Mateo St
- 1011 W Cypress Ave
- 162 Lakeside Ave
- 87 Tennessee St
- 334 Lakeside Ave
- 111 N Center St
- 923 W State St
- 521 W Citrus Ave
- 163 N Center St
- 91 Orangewood Ct
- 1235 W Cypress Ave
- 18 W Cypress Ave
Ask me questions while you tour the home.