9210 Brook St Duluth, MN 55810
Bayview Heights NeighborhoodEstimated Value: $210,000 - $248,000
3
Beds
1
Bath
1,144
Sq Ft
$199/Sq Ft
Est. Value
About This Home
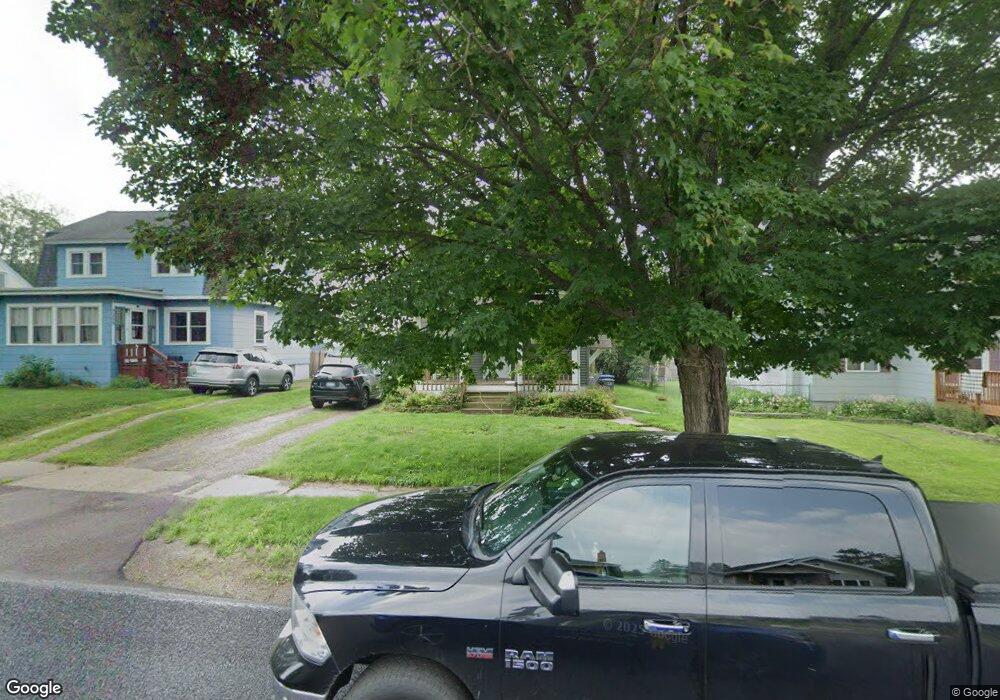
This home is located at 9210 Brook St, Duluth, MN 55810 and is currently estimated at $227,686, approximately $199 per square foot. 9210 Brook St is a home located in St. Louis County with nearby schools including Bay View Elementary School, Jedlicka Middle School, and Proctor Senior High School.
Ownership History
Date
Name
Owned For
Owner Type
Purchase Details
Closed on
May 26, 2011
Sold by
Premier Three Developers Inc
Bought by
Marnich Dallas
Current Estimated Value
Home Financials for this Owner
Home Financials are based on the most recent Mortgage that was taken out on this home.
Original Mortgage
$93,566
Outstanding Balance
$63,104
Interest Rate
4.25%
Mortgage Type
FHA
Estimated Equity
$164,582
Purchase Details
Closed on
Mar 8, 2011
Sold by
Citifinancial Services Inc
Bought by
Premier Three Developers Inc
Purchase Details
Closed on
Apr 27, 2010
Sold by
Barby Pamela Sue
Bought by
Citifinancial Services Inc
Purchase Details
Closed on
Jan 2, 2004
Sold by
Barby Brett Ralph
Bought by
Barby Pamela Sue
Create a Home Valuation Report for This Property
The Home Valuation Report is an in-depth analysis detailing your home's value as well as a comparison with similar homes in the area
Home Values in the Area
Average Home Value in this Area
Purchase History
| Date | Buyer | Sale Price | Title Company |
|---|---|---|---|
| Marnich Dallas | $96,000 | Consolidated Title | |
| Premier Three Developers Inc | $54,900 | Burnet Title | |
| Citifinancial Services Inc | $63,355 | None Available | |
| Barby Pamela Sue | -- | -- |
Source: Public Records
Mortgage History
| Date | Status | Borrower | Loan Amount |
|---|---|---|---|
| Open | Marnich Dallas | $93,566 |
Source: Public Records
Tax History
| Year | Tax Paid | Tax Assessment Tax Assessment Total Assessment is a certain percentage of the fair market value that is determined by local assessors to be the total taxable value of land and additions on the property. | Land | Improvement |
|---|---|---|---|---|
| 2024 | $2,644 | $222,700 | $13,000 | $209,700 |
| 2023 | $2,644 | $222,700 | $13,000 | $209,700 |
| 2022 | $2,586 | $212,400 | $19,400 | $193,000 |
| 2021 | $2,482 | $178,100 | $16,300 | $161,800 |
| 2020 | $2,068 | $174,600 | $16,000 | $158,600 |
| 2019 | $2,014 | $148,100 | $14,100 | $134,000 |
| 2018 | $1,592 | $148,100 | $14,100 | $134,000 |
| 2017 | $1,526 | $122,600 | $20,400 | $102,200 |
| 2016 | $1,458 | $113,300 | $21,200 | $92,100 |
| 2015 | $1,178 | $82,800 | $15,400 | $67,400 |
| 2014 | $1,178 | $82,800 | $15,400 | $67,400 |
Source: Public Records
Map
Nearby Homes
- TBD Meadow St
- 8 4th St
- 48 Arbutus Dr
- 502 3rd Ave
- 1010 Bass Blvd
- 2 Dewberry Ln
- 21 Kalmia Dr
- 63 S Elder Dr
- 33 Ivy Dr
- 1086 U S Highway 2
- 30xx N 81st Ave W
- 26xx N 77th Ave W
- XX10 Lavaque Rd
- XX40 Lavaque Rd
- 5863 Saint Louis River Rd
- 421 Saint Louis River Rd
- 4929 Wild Rose Tr
- 4929 Wildrose Trail
- 5919 Greene St
- 51xxx Wagner Rd
Your Personal Tour Guide
Ask me questions while you tour the home.