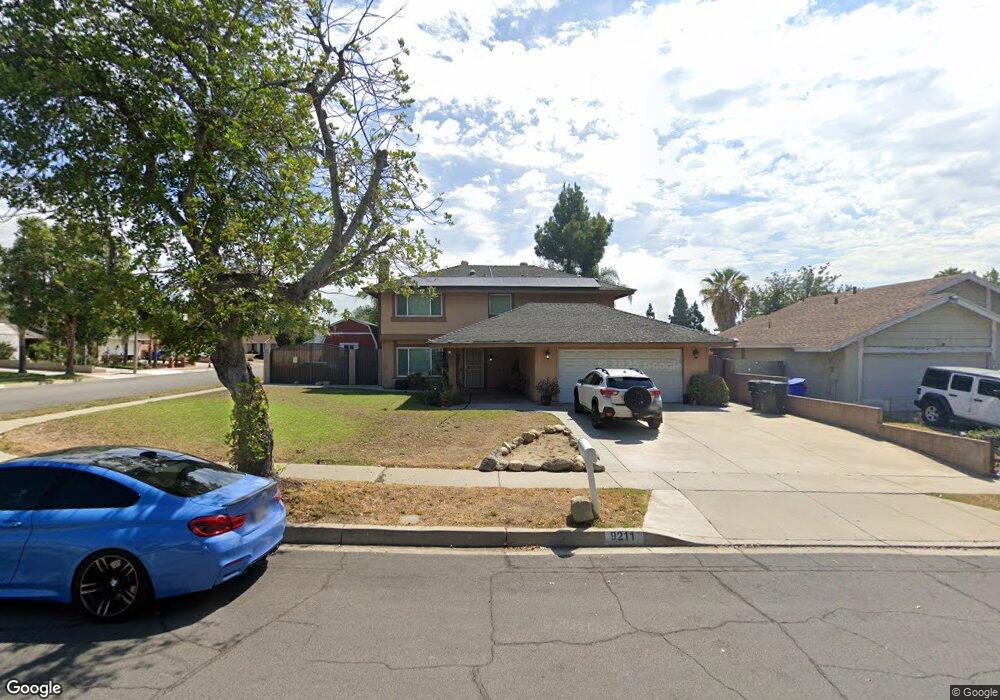
9211 Layton St Rancho Cucamonga, CA 91730
Estimated Value: $713,527 - $808,000
4
Beds
3
Baths
1,840
Sq Ft
$412/Sq Ft
Est. Value
About This Home
This home is located at 9211 Layton St, Rancho Cucamonga, CA 91730 and is currently estimated at $757,882, approximately $411 per square foot. 9211 Layton St is a home located in San Bernardino County with nearby schools including Los Amigos Elementary, Rancho Cucamonga Middle, and Chaffey High School.
Ownership History
Date
Name
Owned For
Owner Type
Purchase Details
Closed on
Dec 16, 2008
Sold by
Citibank Na
Bought by
Saldivar Christine M
Current Estimated Value
Home Financials for this Owner
Home Financials are based on the most recent Mortgage that was taken out on this home.
Original Mortgage
$270,084
Outstanding Balance
$169,607
Interest Rate
5.14%
Mortgage Type
FHA
Estimated Equity
$588,275
Purchase Details
Closed on
Apr 22, 2008
Sold by
Monge Francisco E
Bought by
Citibank Na and First Franklin Mortgage Loan Trust Mortg
Purchase Details
Closed on
Sep 19, 2005
Sold by
Monge Adela
Bought by
Monge Francisco E
Home Financials for this Owner
Home Financials are based on the most recent Mortgage that was taken out on this home.
Original Mortgage
$94,000
Interest Rate
5.7%
Mortgage Type
Stand Alone Second
Purchase Details
Closed on
Aug 23, 2005
Sold by
Hirz Michael G
Bought by
Monge Francisco E
Home Financials for this Owner
Home Financials are based on the most recent Mortgage that was taken out on this home.
Original Mortgage
$94,000
Interest Rate
5.7%
Mortgage Type
Stand Alone Second
Create a Home Valuation Report for This Property
The Home Valuation Report is an in-depth analysis detailing your home's value as well as a comparison with similar homes in the area
Home Values in the Area
Average Home Value in this Area
Purchase History
| Date | Buyer | Sale Price | Title Company |
|---|---|---|---|
| Saldivar Christine M | $275,000 | Ticor Title | |
| Citibank Na | $402,644 | Accommodation | |
| Monge Francisco E | -- | United Title | |
| Monge Francisco E | $470,000 | United Title |
Source: Public Records
Mortgage History
| Date | Status | Borrower | Loan Amount |
|---|---|---|---|
| Open | Saldivar Christine M | $270,084 | |
| Previous Owner | Monge Francisco E | $94,000 | |
| Previous Owner | Monge Francisco E | $376,000 |
Source: Public Records
Tax History Compared to Growth
Tax History
| Year | Tax Paid | Tax Assessment Tax Assessment Total Assessment is a certain percentage of the fair market value that is determined by local assessors to be the total taxable value of land and additions on the property. | Land | Improvement |
|---|---|---|---|---|
| 2025 | $5,979 | $354,134 | $123,624 | $230,510 |
| 2024 | $5,979 | $347,190 | $121,200 | $225,990 |
| 2023 | $5,632 | $340,383 | $118,824 | $221,559 |
| 2022 | $5,567 | $333,709 | $116,494 | $217,215 |
| 2021 | $5,537 | $327,166 | $114,210 | $212,956 |
| 2020 | $5,473 | $323,811 | $113,039 | $210,772 |
| 2019 | $5,455 | $317,462 | $110,823 | $206,639 |
| 2018 | $5,370 | $311,237 | $108,650 | $202,587 |
| 2017 | $5,207 | $305,135 | $106,520 | $198,615 |
| 2016 | $5,136 | $299,152 | $104,431 | $194,721 |
| 2015 | $5,124 | $294,658 | $102,862 | $191,796 |
| 2014 | $3,067 | $288,886 | $100,847 | $188,039 |
Source: Public Records
Map
Nearby Homes
- 9330 Alderwood Dr
- 9357 Culinary Place
- 9175 Jadeite Ave
- 9403 Old Post Dr
- 9523 Sunglow Ct
- 9427 Sun Meadow Ct
- 9593 Brook Dr
- 9550 Springbrook Ct
- 2008 E 5th St
- 1834 N Solano Ave
- 2139 E 4th St #244 St Unit 244
- 2139 E 4th St Unit 135
- 2139 E 4th St Unit 13
- 2139 E 4th St Unit 230
- 2139 E 4th St Unit 79
- 2139 E 4th St Unit 39
- 2139 E 4th St Unit 142
- 2139 E 4th St Unit 176
- 2139 E 4th St Unit 244
- 1360 N Placer Ave
- 9219 Layton St
- 9212 Amethyst Ave
- 9229 Layton St
- 9222 Amethyst Ave
- 9446 Deerbrook St
- 9421 Deerbrook St
- 9456 Deerbrook St
- 9438 Deerbrook St
- 9232 Amethyst Ave
- 9234 Amethyst Ave
- 9241 Layton St
- 9420 Deerbrook St
- 9466 Deerbrook St
- 9413 Deerbrook St
- 9242 Amethyst Ave
- 9414 Deerbrook St
- 9251 Layton St
- 9445 Cameron St
- 9414 Meadow St
- 9455 Cameron St