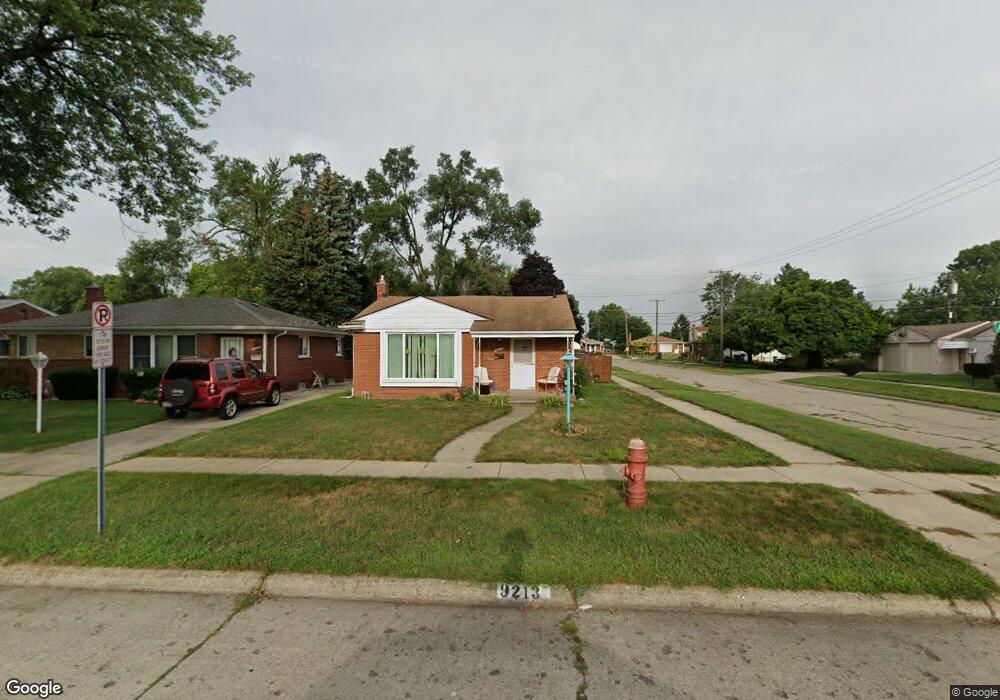
9213 Appleton Redford, MI 48239
Estimated Value: $184,000 - $209,000
Studio
1
Bath
1,097
Sq Ft
$179/Sq Ft
Est. Value
About This Home
This home is located at 9213 Appleton, Redford, MI 48239 and is currently estimated at $196,459, approximately $179 per square foot. 9213 Appleton is a home located in Wayne County with nearby schools including John D. Pierce Middle School, Lee M. Thurston High School, and Global Heights Academy.
Ownership History
Date
Name
Owned For
Owner Type
Purchase Details
Closed on
Jul 8, 2016
Sold by
Vandine Jason L
Bought by
Vandine Jason L
Current Estimated Value
Home Financials for this Owner
Home Financials are based on the most recent Mortgage that was taken out on this home.
Original Mortgage
$70,300
Outstanding Balance
$31,983
Interest Rate
3.66%
Mortgage Type
New Conventional
Estimated Equity
$164,476
Purchase Details
Closed on
Jan 31, 2002
Sold by
Hayees Cheryl
Bought by
Vandine Jason L
Purchase Details
Closed on
Dec 2, 1994
Sold by
Elizabeth Springer Est
Bought by
Hayes Anthony and Hayes Cheryl
Home Financials for this Owner
Home Financials are based on the most recent Mortgage that was taken out on this home.
Original Mortgage
$63,600
Interest Rate
9.24%
Mortgage Type
New Conventional
Create a Home Valuation Report for This Property
The Home Valuation Report is an in-depth analysis detailing your home's value as well as a comparison with similar homes in the area
Home Values in the Area
Average Home Value in this Area
Purchase History
| Date | Buyer | Sale Price | Title Company |
|---|---|---|---|
| Vandine Jason L | -- | Attorney | |
| Vandine Jason L | $126,000 | -- | |
| Hayes Anthony | $67,000 | -- |
Source: Public Records
Mortgage History
| Date | Status | Borrower | Loan Amount |
|---|---|---|---|
| Open | Vandine Jason L | $70,300 | |
| Previous Owner | Hayes Anthony | $63,600 |
Source: Public Records
Tax History
| Year | Tax Paid | Tax Assessment Tax Assessment Total Assessment is a certain percentage of the fair market value that is determined by local assessors to be the total taxable value of land and additions on the property. | Land | Improvement |
|---|---|---|---|---|
| 2025 | $695 | $86,100 | $0 | $0 |
| 2024 | $677 | $76,600 | $0 | $0 |
| 2023 | $648 | $66,100 | $0 | $0 |
| 2022 | $1,930 | $56,300 | $0 | $0 |
| 2021 | $1,875 | $54,000 | $0 | $0 |
| 2020 | $1,850 | $48,600 | $0 | $0 |
| 2019 | $1,811 | $36,900 | $0 | $0 |
| 2018 | $583 | $30,600 | $0 | $0 |
| 2017 | $2,018 | $28,100 | $0 | $0 |
| 2016 | $1,573 | $26,200 | $0 | $0 |
| 2015 | $2,450 | $24,500 | $0 | $0 |
| 2013 | $2,540 | $26,000 | $0 | $0 |
| 2012 | $1,645 | $28,700 | $6,500 | $22,200 |
Source: Public Records
Map
Nearby Homes
Your Personal Tour Guide
Ask me questions while you tour the home.