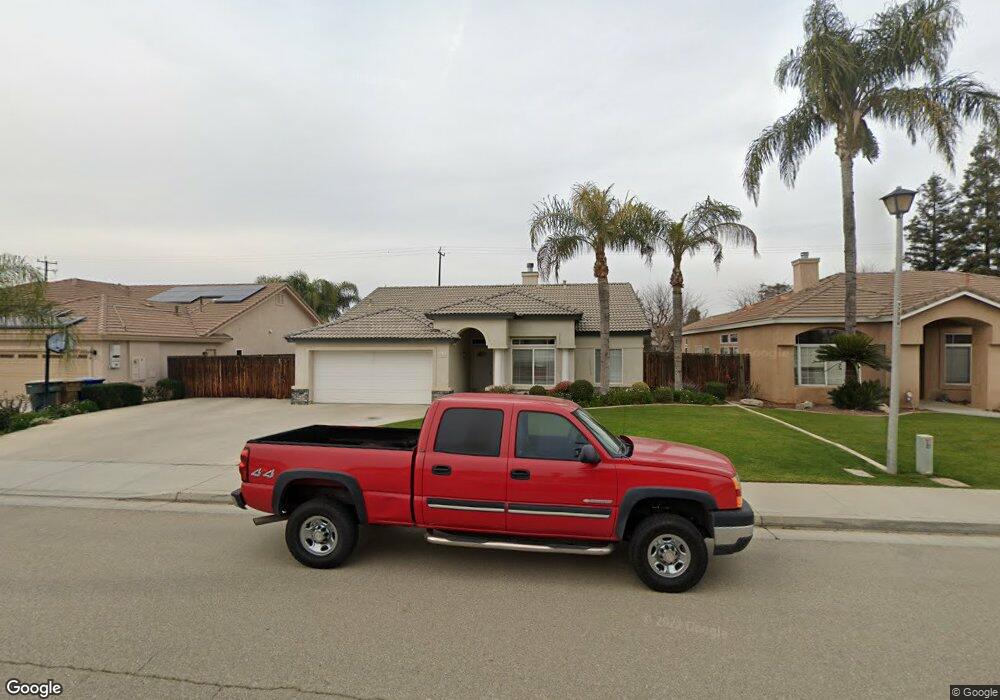
9216 Quail Brook Ct Unit 3 Bakersfield, CA 93312
Estimated Value: $440,950 - $530,000
3
Beds
2
Baths
1,818
Sq Ft
$261/Sq Ft
Est. Value
About This Home
This home is located at 9216 Quail Brook Ct Unit 3, Bakersfield, CA 93312 and is currently estimated at $473,738, approximately $260 per square foot. 9216 Quail Brook Ct Unit 3 is a home located in Kern County with nearby schools including Olive Drive Elementary School, Norris Middle School, and Centennial High School.
Ownership History
Date
Name
Owned For
Owner Type
Purchase Details
Closed on
Aug 25, 2011
Sold by
Gabella Jose Miguel
Bought by
Pagano Vincent A
Current Estimated Value
Home Financials for this Owner
Home Financials are based on the most recent Mortgage that was taken out on this home.
Original Mortgage
$56,625
Outstanding Balance
$4,591
Interest Rate
4.26%
Mortgage Type
New Conventional
Estimated Equity
$469,147
Purchase Details
Closed on
May 24, 2000
Sold by
Probuilt Development & Construction Inc
Bought by
Gabella Jose Miguel
Home Financials for this Owner
Home Financials are based on the most recent Mortgage that was taken out on this home.
Original Mortgage
$118,300
Interest Rate
8.18%
Purchase Details
Closed on
Feb 2, 2000
Sold by
Norris Road Venture
Bought by
Probuilt Development & Construction Inc
Create a Home Valuation Report for This Property
The Home Valuation Report is an in-depth analysis detailing your home's value as well as a comparison with similar homes in the area
Home Values in the Area
Average Home Value in this Area
Purchase History
| Date | Buyer | Sale Price | Title Company |
|---|---|---|---|
| Pagano Vincent A | $75,500 | Chicago Title Company | |
| Gabella Jose Miguel | $153,500 | American Title Co | |
| Probuilt Development & Construction Inc | $32,000 | American Title Co |
Source: Public Records
Mortgage History
| Date | Status | Borrower | Loan Amount |
|---|---|---|---|
| Open | Pagano Vincent A | $56,625 | |
| Previous Owner | Gabella Jose Miguel | $118,300 |
Source: Public Records
Tax History Compared to Growth
Tax History
| Year | Tax Paid | Tax Assessment Tax Assessment Total Assessment is a certain percentage of the fair market value that is determined by local assessors to be the total taxable value of land and additions on the property. | Land | Improvement |
|---|---|---|---|---|
| 2025 | $4,435 | $226,076 | $62,796 | $163,280 |
| 2024 | $4,355 | $221,644 | $61,565 | $160,079 |
| 2023 | $4,355 | $217,299 | $60,358 | $156,941 |
| 2022 | $4,273 | $213,039 | $59,175 | $153,864 |
| 2021 | $4,176 | $208,863 | $58,015 | $150,848 |
| 2020 | $4,071 | $206,723 | $57,421 | $149,302 |
| 2019 | $4,017 | $206,723 | $57,421 | $149,302 |
| 2018 | $3,911 | $198,698 | $55,193 | $143,505 |
| 2017 | $3,910 | $194,803 | $54,111 | $140,692 |
| 2016 | $3,588 | $190,984 | $53,050 | $137,934 |
| 2015 | $3,528 | $188,117 | $52,254 | $135,863 |
| 2014 | $3,452 | $184,433 | $51,231 | $133,202 |
Source: Public Records
Map
Nearby Homes
- 9253 Cortona Ct
- 9003 Forest Oaks Ct
- 9103 Kristina Lynn Ct
- 7656 Calloway Dr
- 9119 Claro de Luna Dr
- 7422 Allenmier Ct
- 7306 Cafe Rouge Dr
- 7213 Cafe Rouge Dr
- 9313 Rancho Viejo Dr
- 8707 Kenwick St
- 8610 Kowa St
- 9513 Rancho Viejo Dr
- 9318 Rancho Viejo Dr
- 7118 Bluetail Ln
- 8615 Littleton St
- 7700 Ruthburg Way
- 8522 Jean Anne St
- 9003 Del Palma Dr
- 8515 Jean Anne St
- 8511 Jean Anne St
- 9208 Quail Brook Ct
- 9222 Quail Brook Ct
- 9200 Quail Brook Ct
- 9217 Quail Brook Ct
- 9304 Quail Brook Ct Unit 5
- 9126 Quail Brook Ct
- 9209 Quail Brook Ct
- 9223 Quail Brook Ct
- 9201 Quail Brook Ct
- 9231 Val di Chiana Dr
- 9249 Val di Chiana Dr
- 9312 Quail Brook Ct Unit 5
- 9213 Val di Chiana Dr
- 9118 Quail Brook Ct
- 9127 Quail Brook Ct
- 9157 Val di Chiana Dr
- 9311 Quail Brook Ct
- 9325 Val di Chiana Dr
- 9320 Quail Brook Ct
- 9218 Cripple Creek Ave