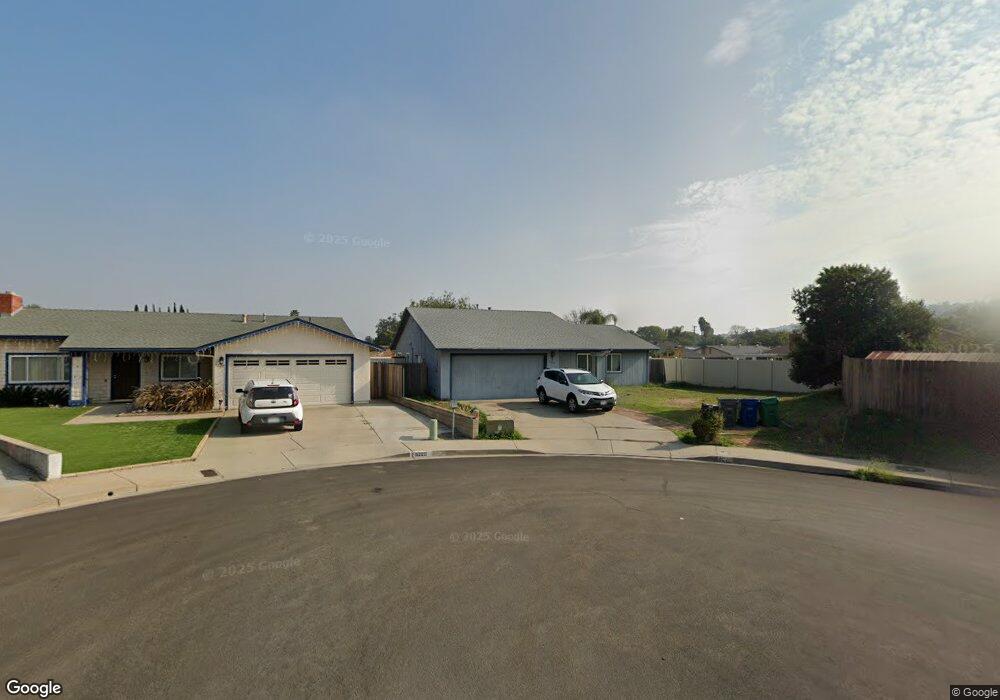
9219 Via de Cristina Santee, CA 92071
Estimated Value: $791,860 - $803,000
3
Beds
2
Baths
1,236
Sq Ft
$643/Sq Ft
Est. Value
About This Home
This home is located at 9219 Via de Cristina, Santee, CA 92071 and is currently estimated at $794,715, approximately $642 per square foot. 9219 Via de Cristina is a home located in San Diego County with nearby schools including Pride Academy At Prospect Avenue and West Hills High School.
Ownership History
Date
Name
Owned For
Owner Type
Purchase Details
Closed on
Sep 23, 2011
Sold by
Masso Jawad J and Masso Abeer
Bought by
Knight Sam Thomas and Knight Debbie M
Current Estimated Value
Home Financials for this Owner
Home Financials are based on the most recent Mortgage that was taken out on this home.
Original Mortgage
$297,767
Outstanding Balance
$202,245
Interest Rate
4.09%
Mortgage Type
VA
Estimated Equity
$592,470
Purchase Details
Closed on
Sep 13, 2011
Sold by
Masso Jawad J
Bought by
Masso Jawad J and Masso Abeer
Home Financials for this Owner
Home Financials are based on the most recent Mortgage that was taken out on this home.
Original Mortgage
$297,767
Outstanding Balance
$202,245
Interest Rate
4.09%
Mortgage Type
VA
Estimated Equity
$592,470
Purchase Details
Closed on
May 10, 1995
Sold by
Masso Noel I
Bought by
Masso Noel I
Purchase Details
Closed on
Apr 21, 1987
Create a Home Valuation Report for This Property
The Home Valuation Report is an in-depth analysis detailing your home's value as well as a comparison with similar homes in the area
Home Values in the Area
Average Home Value in this Area
Purchase History
| Date | Buyer | Sale Price | Title Company |
|---|---|---|---|
| Knight Sam Thomas | $295,500 | Lawyers Title | |
| Masso Jawad J | -- | Lawyers Title | |
| Masso Noel I | -- | -- | |
| -- | $95,000 | -- |
Source: Public Records
Mortgage History
| Date | Status | Borrower | Loan Amount |
|---|---|---|---|
| Open | Knight Sam Thomas | $297,767 |
Source: Public Records
Tax History Compared to Growth
Tax History
| Year | Tax Paid | Tax Assessment Tax Assessment Total Assessment is a certain percentage of the fair market value that is determined by local assessors to be the total taxable value of land and additions on the property. | Land | Improvement |
|---|---|---|---|---|
| 2025 | $4,404 | $366,124 | $132,332 | $233,792 |
| 2024 | $4,404 | $358,946 | $129,738 | $229,208 |
| 2023 | $4,270 | $351,909 | $127,195 | $224,714 |
| 2022 | $4,238 | $345,009 | $124,701 | $220,308 |
| 2021 | $4,179 | $338,245 | $122,256 | $215,989 |
| 2020 | $4,128 | $334,778 | $121,003 | $213,775 |
| 2019 | $3,984 | $328,215 | $118,631 | $209,584 |
| 2018 | $3,903 | $321,780 | $116,305 | $205,475 |
| 2017 | $3,852 | $315,472 | $114,025 | $201,447 |
| 2016 | $3,736 | $309,288 | $111,790 | $197,498 |
| 2015 | $3,687 | $304,643 | $110,111 | $194,532 |
| 2014 | $3,613 | $298,677 | $107,955 | $190,722 |
Source: Public Records
Map
Nearby Homes
- 8850 Ellsworth Cir
- 8734 Atlas View Dr
- 9182 Tonya Ln
- 8627 Paseo Del Sol
- 9428 Prospect Ave
- 9459 Mission Gorge Rd Unit 68
- 9459 Mission Gorge Rd Unit 17
- 8581 Paseo Del Sol
- 9421 Pryor Dr
- 8588 Shanes Way
- 0000 Prospect Ave
- 8624 La Butte Ln
- 9121 Farrington Dr
- 9205 Camino Del Verde
- 8672 Camden Dr
- 8211 Fanita Dr
- 8621 Arminda Cir Unit 30
- 8714 Dania Ct
- 2182 Farrington Dr
- 8685 Amherst St
- 9220 Via de Cristina
- 9214 Via de Amor
- 8750 Ellsworth Cir
- 8756 Ellsworth Cir
- 8746 Ellsworth Cir
- 9208 Via de Amor
- 8765 Via de Victoria
- 9220 Via de Amor
- 9214 Via de Cristina
- 8740 Ellsworth Cir
- 9208 Via de Cristina
- 8760 Ellsworth Cir
- 9202 Via de Amor
- 9202 Via de Cristina
- 8736 Ellsworth Cir
- 8766 Ellsworth Cir
- 9219 Via de Amor
- 8753 Ellsworth Cir
- 8749 Ellsworth Cir
- 9187 Via de Cristina