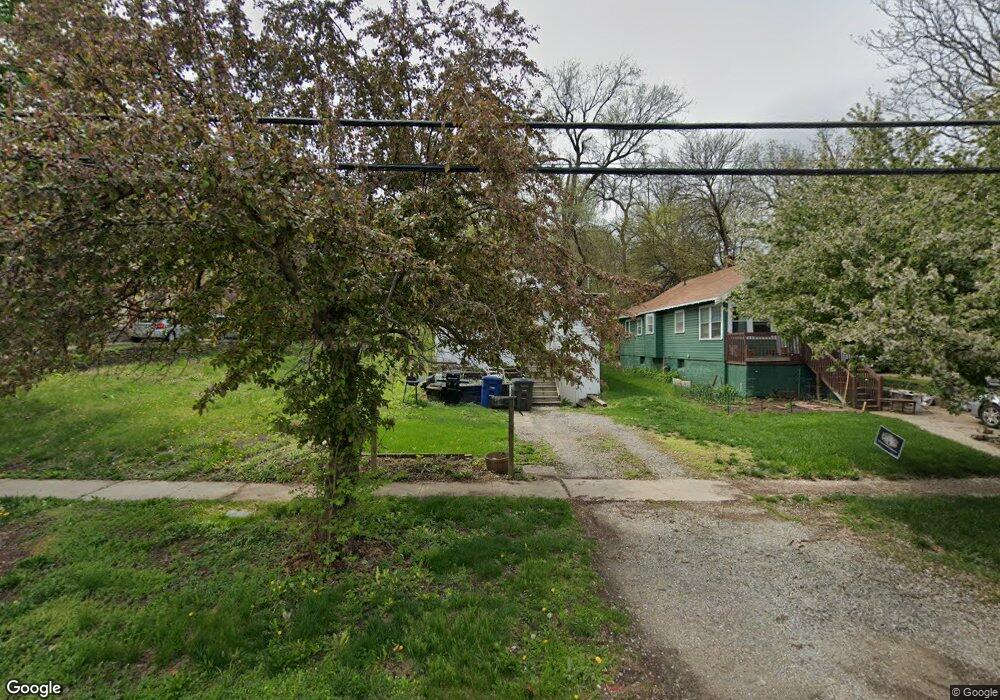
922 28th St Des Moines, IA 50312
Drake NeighborhoodEstimated Value: $124,000 - $161,000
2
Beds
1
Bath
773
Sq Ft
$177/Sq Ft
Est. Value
About This Home
This home is located at 922 28th St, Des Moines, IA 50312 and is currently estimated at $136,612, approximately $176 per square foot. 922 28th St is a home located in Polk County with nearby schools including Hubbell Elementary, Callanan Middle School, and Roosevelt High School.
Ownership History
Date
Name
Owned For
Owner Type
Purchase Details
Closed on
May 18, 2005
Sold by
Crnkic Husein and Crnkic Selma
Bought by
Crandall Kendra Christine
Current Estimated Value
Home Financials for this Owner
Home Financials are based on the most recent Mortgage that was taken out on this home.
Original Mortgage
$11,100
Interest Rate
5.91%
Mortgage Type
Stand Alone Second
Purchase Details
Closed on
Jan 12, 2005
Sold by
Bank One Na
Bought by
Crnkic Husein and Crnkic Selma
Purchase Details
Closed on
Aug 25, 2000
Sold by
Drake University
Bought by
Buttz Brenda and Sheeley Mark A
Home Financials for this Owner
Home Financials are based on the most recent Mortgage that was taken out on this home.
Original Mortgage
$32,800
Interest Rate
8.26%
Create a Home Valuation Report for This Property
The Home Valuation Report is an in-depth analysis detailing your home's value as well as a comparison with similar homes in the area
Home Values in the Area
Average Home Value in this Area
Purchase History
| Date | Buyer | Sale Price | Title Company |
|---|---|---|---|
| Crandall Kendra Christine | $55,000 | -- | |
| Crnkic Husein | $17,000 | -- | |
| Buttz Brenda | $26,500 | -- |
Source: Public Records
Mortgage History
| Date | Status | Borrower | Loan Amount |
|---|---|---|---|
| Closed | Crandall Kendra Christine | $11,100 | |
| Open | Crandall Kendra Christine | $44,400 | |
| Previous Owner | Buttz Brenda | $32,800 |
Source: Public Records
Tax History
| Year | Tax Paid | Tax Assessment Tax Assessment Total Assessment is a certain percentage of the fair market value that is determined by local assessors to be the total taxable value of land and additions on the property. | Land | Improvement |
|---|---|---|---|---|
| 2025 | $1,550 | $103,700 | $35,000 | $68,700 |
| 2024 | $1,550 | $89,300 | $30,100 | $59,200 |
| 2023 | $1,452 | $89,300 | $30,100 | $59,200 |
| 2022 | $1,440 | $70,500 | $24,300 | $46,200 |
| 2021 | $1,332 | $70,500 | $24,300 | $46,200 |
| 2020 | $1,380 | $62,000 | $21,500 | $40,500 |
| 2019 | $1,268 | $62,000 | $21,500 | $40,500 |
| 2018 | $1,250 | $55,700 | $14,800 | $40,900 |
| 2017 | $1,132 | $55,700 | $14,800 | $40,900 |
| 2016 | $1,098 | $50,400 | $13,300 | $37,100 |
| 2015 | $1,098 | $50,400 | $13,300 | $37,100 |
| 2014 | $1,132 | $51,300 | $13,500 | $37,800 |
Source: Public Records
Map
Nearby Homes
- 926 28th St
- 930 28th St
- 914 28th St
- 920 28th St
- 934 28th St
- 910 28th St
- 925-925 28th St Unit 925
- 925-925 28th St Unit 921
- 2808 School St
- 945 28th St
- 923 28th St
- 947 28th St
- 2814 School St
- 949 28th St
- 915-925 28th St Unit 917
- 915-925 28th St Unit 923
- 904 28th St
- 942 28th St
- 2820 School St
- 900 E 28th St
Your Personal Tour Guide
Ask me questions while you tour the home.