Estimated Value: $214,000 - $288,737
3
Beds
2
Baths
1,176
Sq Ft
$214/Sq Ft
Est. Value
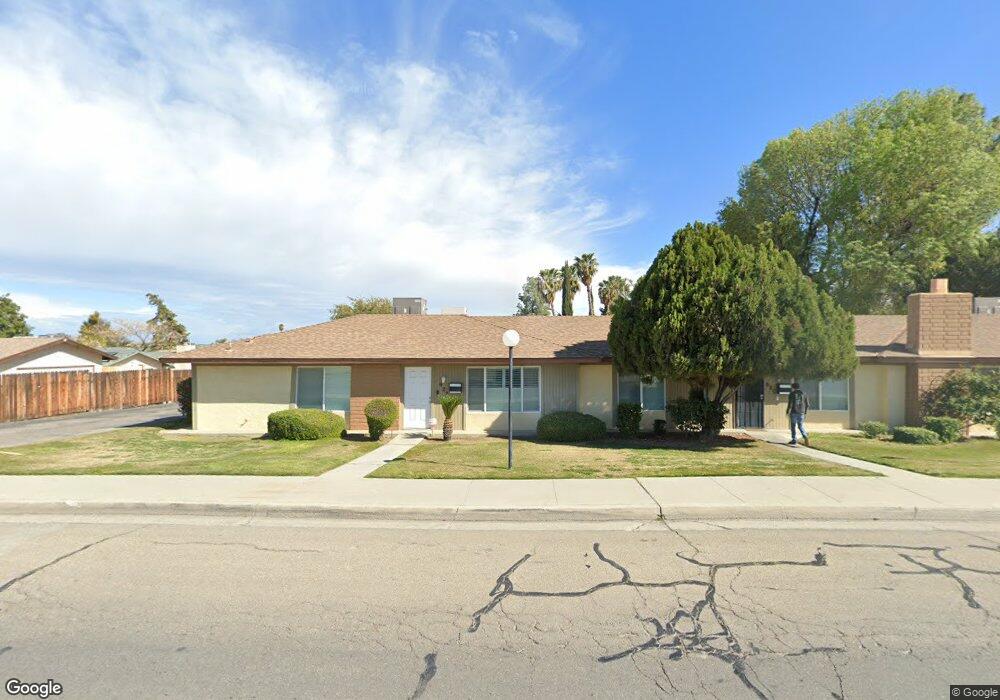
About This Home
This home is located at 922 4th St Unit 19, Taft, CA 93268 and is currently estimated at $251,369, approximately $213 per square foot. 922 4th St Unit 19 is a home located in Kern County with nearby schools including Roosevelt Elementary School, Taft Primary School, and Lincoln Junior High School.
Ownership History
Date
Name
Owned For
Owner Type
Purchase Details
Closed on
Jul 12, 2007
Sold by
Foster Karen S
Bought by
Foster Lansing Pope
Current Estimated Value
Home Financials for this Owner
Home Financials are based on the most recent Mortgage that was taken out on this home.
Original Mortgage
$201,000
Outstanding Balance
$125,697
Interest Rate
6.51%
Mortgage Type
New Conventional
Estimated Equity
$125,672
Purchase Details
Closed on
Jul 3, 2007
Sold by
Foster Lansing Pope
Bought by
Maui Malieo T
Home Financials for this Owner
Home Financials are based on the most recent Mortgage that was taken out on this home.
Original Mortgage
$201,000
Outstanding Balance
$125,697
Interest Rate
6.51%
Mortgage Type
New Conventional
Estimated Equity
$125,672
Purchase Details
Closed on
Jul 29, 2002
Sold by
Foster Lansing Pope and Brown Lorelle Grace
Bought by
Foster Lansing Pope
Purchase Details
Closed on
Nov 7, 1997
Sold by
Foster William Pope Family Tr and Pope William
Bought by
Foster William Pope and The Foster Family Exemption Tr
Create a Home Valuation Report for This Property
The Home Valuation Report is an in-depth analysis detailing your home's value as well as a comparison with similar homes in the area
Home Values in the Area
Average Home Value in this Area
Purchase History
| Date | Buyer | Sale Price | Title Company |
|---|---|---|---|
| Foster Lansing Pope | -- | First American Title Company | |
| Maui Malieo T | $201,000 | First American Title Company | |
| Foster Lansing Pope | -- | -- | |
| Foster Lansing Pope | -- | -- | |
| Foster William Pope | -- | -- |
Source: Public Records
Mortgage History
| Date | Status | Borrower | Loan Amount |
|---|---|---|---|
| Open | Maui Malieo T | $201,000 |
Source: Public Records
Tax History
| Year | Tax Paid | Tax Assessment Tax Assessment Total Assessment is a certain percentage of the fair market value that is determined by local assessors to be the total taxable value of land and additions on the property. | Land | Improvement |
|---|---|---|---|---|
| 2025 | $3,077 | $259,597 | $52,532 | $207,065 |
| 2024 | $2,942 | $254,508 | $51,502 | $203,006 |
| 2023 | $2,942 | $249,519 | $50,493 | $199,026 |
| 2022 | $2,899 | $244,627 | $49,503 | $195,124 |
| 2021 | $2,919 | $239,832 | $48,533 | $191,299 |
| 2020 | $2,756 | $237,374 | $48,036 | $189,338 |
| 2019 | $2,707 | $237,374 | $48,036 | $189,338 |
| 2018 | $2,639 | $228,159 | $46,172 | $181,987 |
| 2017 | $2,519 | $223,686 | $45,267 | $178,419 |
| 2016 | $2,679 | $219,301 | $44,380 | $174,921 |
| 2015 | $2,439 | $216,008 | $43,714 | $172,294 |
| 2014 | $2,315 | $211,778 | $42,858 | $168,920 |
Source: Public Records
Map
Nearby Homes
Your Personal Tour Guide
Ask me questions while you tour the home.