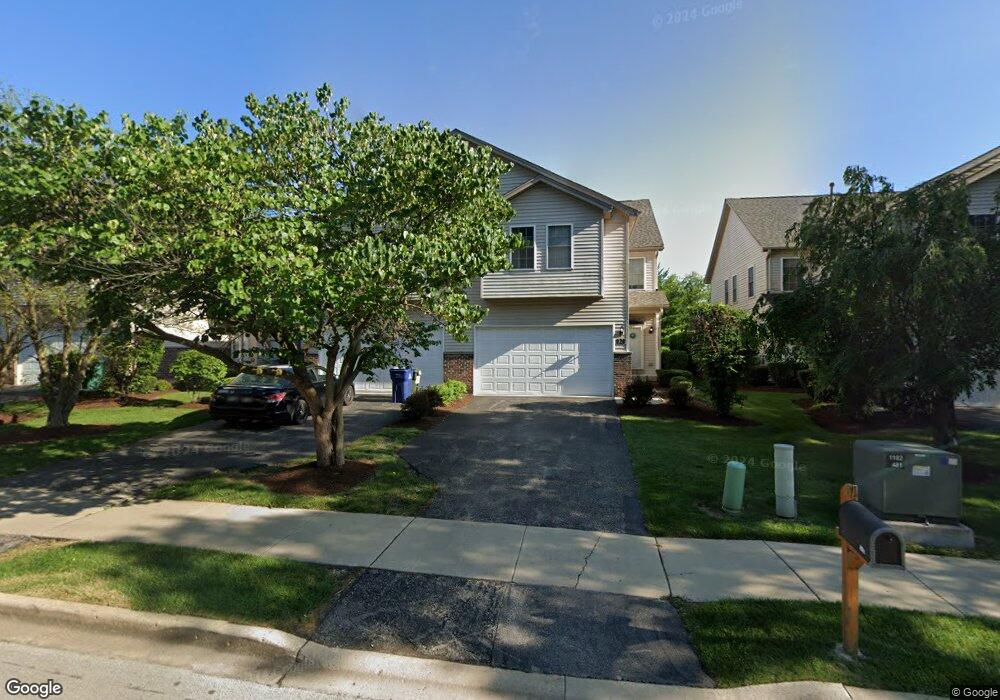
922 Case St Naperville, IL 60563
North Naperville NeighborhoodEstimated Value: $500,457 - $619,000
Studio
1
Bath
2,116
Sq Ft
$258/Sq Ft
Est. Value
About This Home
This home is located at 922 Case St, Naperville, IL 60563 and is currently estimated at $545,364, approximately $257 per square foot. 922 Case St is a home located in DuPage County with nearby schools including Beebe Elementary School, Jefferson Jr High School, and Naperville North High School.
Ownership History
Date
Name
Owned For
Owner Type
Purchase Details
Closed on
Jan 10, 2005
Sold by
Viking Development Llc
Bought by
Singh Harpreet and Kaur Prabhleen
Current Estimated Value
Home Financials for this Owner
Home Financials are based on the most recent Mortgage that was taken out on this home.
Original Mortgage
$296,000
Outstanding Balance
$140,677
Interest Rate
4.87%
Mortgage Type
Purchase Money Mortgage
Estimated Equity
$404,687
Purchase Details
Closed on
Jan 7, 2005
Sold by
Reishus Margaret H and Margaret H Reishus Trust
Bought by
Viking Development Llc
Home Financials for this Owner
Home Financials are based on the most recent Mortgage that was taken out on this home.
Original Mortgage
$296,000
Outstanding Balance
$140,677
Interest Rate
4.87%
Mortgage Type
Purchase Money Mortgage
Estimated Equity
$404,687
Create a Home Valuation Report for This Property
The Home Valuation Report is an in-depth analysis detailing your home's value as well as a comparison with similar homes in the area
Home Values in the Area
Average Home Value in this Area
Purchase History
| Date | Buyer | Sale Price | Title Company |
|---|---|---|---|
| Singh Harpreet | $375,000 | First American Title | |
| Viking Development Llc | $30,000 | First American Title |
Source: Public Records
Mortgage History
| Date | Status | Borrower | Loan Amount |
|---|---|---|---|
| Open | Singh Harpreet | $296,000 | |
| Closed | Singh Harpreet | $36,850 |
Source: Public Records
Tax History
| Year | Tax Paid | Tax Assessment Tax Assessment Total Assessment is a certain percentage of the fair market value that is determined by local assessors to be the total taxable value of land and additions on the property. | Land | Improvement |
|---|---|---|---|---|
| 2024 | -- | $149,235 | $24,533 | $124,702 |
| 2023 | $8,006 | $136,200 | $22,390 | $113,810 |
| 2022 | $8,006 | $129,710 | $21,320 | $108,390 |
| 2021 | $7,711 | $124,800 | $20,510 | $104,290 |
| 2020 | $7,546 | $122,560 | $20,140 | $102,420 |
| 2019 | $7,323 | $117,260 | $19,270 | $97,990 |
| 2018 | $7,483 | $119,650 | $19,660 | $99,990 |
| 2017 | $7,331 | $115,620 | $19,000 | $96,620 |
| 2016 | $7,182 | $111,440 | $18,310 | $93,130 |
| 2015 | $7,600 | $111,430 | $18,310 | $93,120 |
| 2014 | $7,847 | $111,430 | $18,310 | $93,120 |
| 2013 | $7,729 | $111,690 | $18,350 | $93,340 |
Source: Public Records
Map
Nearby Homes
- 26W250 Case St
- 5S365 Vest Ave
- 1437 N Charles Ave
- 1308 N Wright St
- 825 Biltmore Ct
- 5S661 Wright St
- 1165 Dickens Ave
- 952 N Loomis St
- 930 N Loomis St
- 596 Windham Ln
- 905 Kennebec Ln
- 1111 Samstag Ct
- 837 N Loomis St
- 1112 Iroquois Ave Unit 12
- 30w130 Wheeler Cir
- 941 Coletta Cir
- 906 Coletta Cir
- 809 N Brainard St
- 1314 Haverhill Cir
- 717 N Brainard St
- 928 Case St
- 920 Case St
- 914 Case St
- 912 Case St
- 930 Case St
- 906 Case St
- 904 Case St
- 929 E Ogden Ave
- 26W170 Case St
- 5S469 Sherman Ave
- 5S520 Sherman Ave
- 5S458 Sherman Ave
- 5S534 Sherman Ave
- 5S510 Sherman Ave
- 5S453 Sherman Ave
- 5S476 Sherman Ave
- 5S445 Sherman Ave
- 446 Vest Ave
- 5S450 Vest Ave
- 5S437 Sherman Ave
Your Personal Tour Guide
Ask me questions while you tour the home.