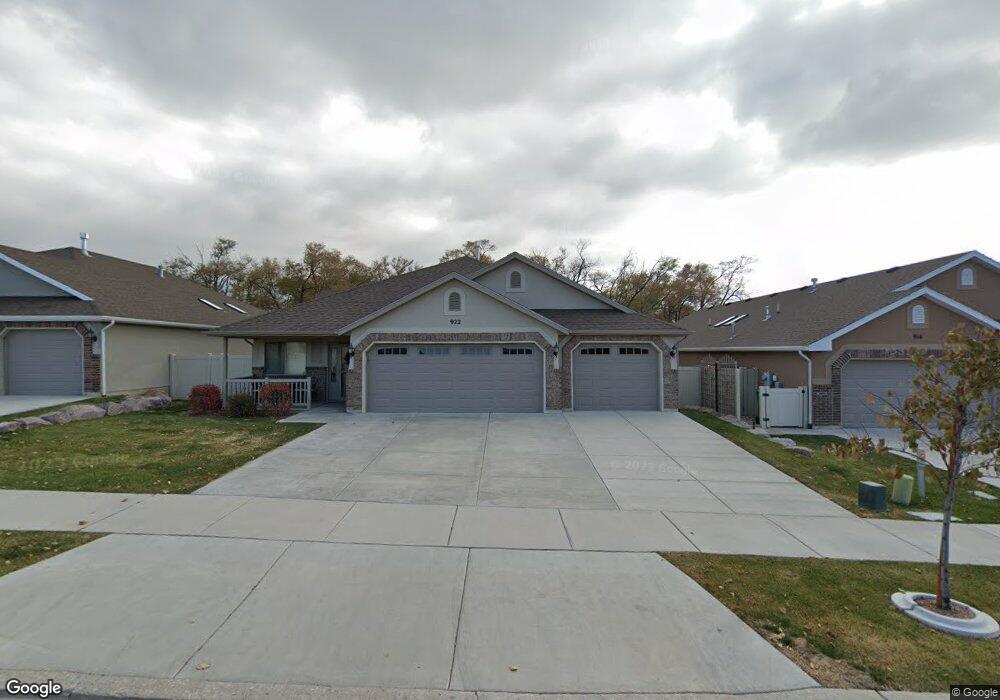
922 E Frost Way Layton, UT 84040
Estimated Value: $555,000 - $683,994
3
Beds
2
Baths
2,117
Sq Ft
$304/Sq Ft
Est. Value
About This Home
This home is located at 922 E Frost Way, Layton, UT 84040 and is currently estimated at $643,249, approximately $303 per square foot. 922 E Frost Way is a home located in Davis County with nearby schools including Sarah Jane Adams Elementary School, North Layton Junior High School, and Northridge High School.
Ownership History
Date
Name
Owned For
Owner Type
Purchase Details
Closed on
Dec 9, 2021
Sold by
Rene Harbertson and The Rene Harbertson Trust
Bought by
Stennett Sandra F
Current Estimated Value
Purchase Details
Closed on
Jan 13, 2020
Sold by
Harbertson Rene
Bought by
Harbertson Rene and Rene Harbertson Revocable Trus
Purchase Details
Closed on
Jan 23, 2015
Sold by
Ovation Homes Llc
Bought by
Harbertson Rene
Purchase Details
Closed on
Jun 4, 2014
Sold by
Capital Reef Management Llc
Bought by
Ovation Homes Llc
Home Financials for this Owner
Home Financials are based on the most recent Mortgage that was taken out on this home.
Original Mortgage
$246,900
Interest Rate
4.27%
Mortgage Type
Construction
Purchase Details
Closed on
Feb 28, 2014
Sold by
Dale Corp
Bought by
Barlow Haven J and The Haven J Barlow Trust
Create a Home Valuation Report for This Property
The Home Valuation Report is an in-depth analysis detailing your home's value as well as a comparison with similar homes in the area
Home Values in the Area
Average Home Value in this Area
Purchase History
| Date | Buyer | Sale Price | Title Company |
|---|---|---|---|
| Stennett Sandra F | -- | Stewart Title Ins Age | |
| Harbertson Rene | -- | None Available | |
| Harbertson Rene | -- | Lincoln Title Insur | |
| Ovation Homes Llc | -- | Lincoln Title Insura | |
| Barlow Haven J | -- | Lincoln Title Insura |
Source: Public Records
Mortgage History
| Date | Status | Borrower | Loan Amount |
|---|---|---|---|
| Previous Owner | Ovation Homes Llc | $246,900 |
Source: Public Records
Tax History Compared to Growth
Tax History
| Year | Tax Paid | Tax Assessment Tax Assessment Total Assessment is a certain percentage of the fair market value that is determined by local assessors to be the total taxable value of land and additions on the property. | Land | Improvement |
|---|---|---|---|---|
| 2025 | $3,499 | $341,000 | $109,164 | $231,836 |
| 2024 | $3,225 | $317,900 | $135,400 | $182,500 |
| 2023 | $3,343 | $588,000 | $188,369 | $399,631 |
| 2022 | $3,469 | $333,301 | $100,524 | $232,777 |
| 2021 | $3,167 | $453,000 | $152,165 | $300,835 |
| 2020 | $2,898 | $397,000 | $119,993 | $277,007 |
| 2019 | $2,924 | $395,000 | $107,878 | $287,122 |
| 2018 | $2,712 | $368,000 | $64,509 | $303,491 |
| 2016 | $2,439 | $173,030 | $32,937 | $140,093 |
| 2015 | $1,968 | $132,361 | $32,937 | $99,424 |
Source: Public Records
Map
Nearby Homes
- 979 E Frost Way
- 3450 N Fairfield Rd Unit 3
- 1252 E Larkspur Way
- 1920 N Camellia Way Unit 406
- 1930 N Camellia Way E Unit 407
- 1313 E Larkspur Way
- 1305 E Larkspur Way
- 1308 E Larkspur Way
- 1340 E Hollyhock Way
- 1379 E Petunia Ct
- Richards Plan at Eastridge Park - The Vistas
- Brynlee Plan at Eastridge Park - The Vistas
- Brynlee Plan at Eastridge Park - The Heights
- Ontario Plan at Eastridge Park - The Heights
- Mclauren Plan at Eastridge Park - The Vistas
- Escher Plan at Eastridge Park - The Vistas
- Rivershore Plan at Eastridge Park - The Vistas
- Helene Plan at Eastridge Park - The Vistas
- Bromley Plan at Eastridge Park - The Heights
- Beringwood Plan at Eastridge Park - The Heights