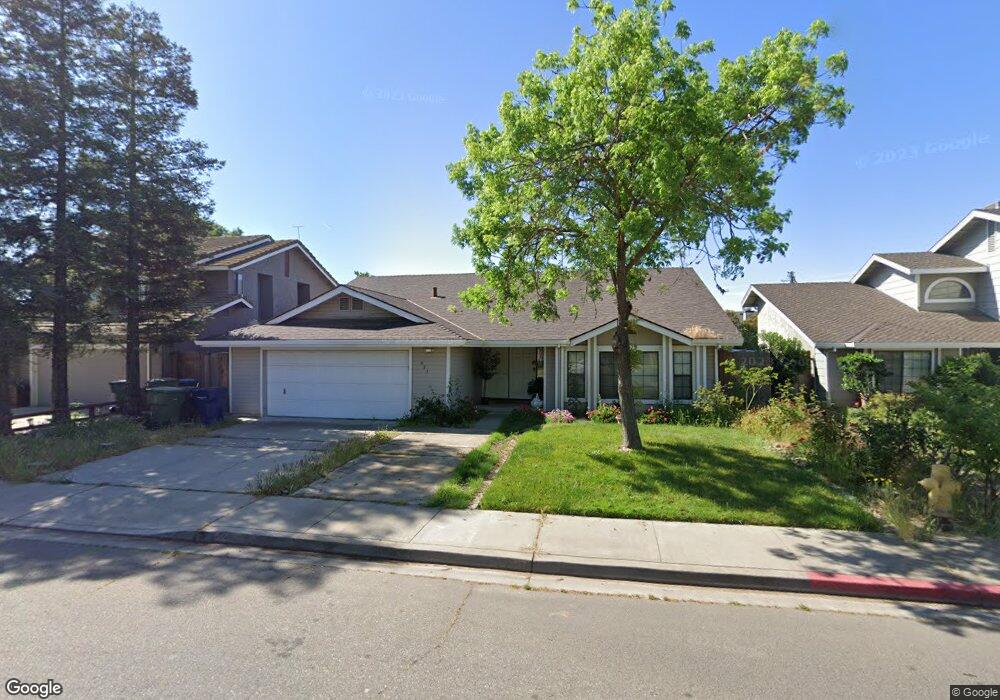
922 Gettysburg St Turlock, CA 95382
Estimated Value: $461,000 - $511,000
3
Beds
2
Baths
1,872
Sq Ft
$257/Sq Ft
Est. Value
About This Home
This home is located at 922 Gettysburg St, Turlock, CA 95382 and is currently estimated at $480,341, approximately $256 per square foot. 922 Gettysburg St is a home located in Stanislaus County with nearby schools including Walter M. Brown Elementary School, Turlock Junior High School, and Marvin A. Dutcher Middle School.
Ownership History
Date
Name
Owned For
Owner Type
Purchase Details
Closed on
Nov 20, 2013
Sold by
Jonoubei Rodney
Bought by
Jonoubei Rodney and Jonoubei Aksena Zaea
Current Estimated Value
Purchase Details
Closed on
Apr 19, 2007
Sold by
Jonoubei Aksena Z
Bought by
Jonoubei Rodney
Home Financials for this Owner
Home Financials are based on the most recent Mortgage that was taken out on this home.
Original Mortgage
$160,000
Outstanding Balance
$96,474
Interest Rate
6.1%
Mortgage Type
Purchase Money Mortgage
Estimated Equity
$383,867
Purchase Details
Closed on
Apr 17, 2007
Sold by
Jonoubei San and Jonoubei Grace Shnorik
Bought by
Jonoubei Rodney
Home Financials for this Owner
Home Financials are based on the most recent Mortgage that was taken out on this home.
Original Mortgage
$160,000
Outstanding Balance
$96,474
Interest Rate
6.1%
Mortgage Type
Purchase Money Mortgage
Estimated Equity
$383,867
Purchase Details
Closed on
Jun 11, 1994
Sold by
Jonoubei Rodney and Jonoubei Raymond
Bought by
Jonoubei San and Jonoubei Grace
Create a Home Valuation Report for This Property
The Home Valuation Report is an in-depth analysis detailing your home's value as well as a comparison with similar homes in the area
Home Values in the Area
Average Home Value in this Area
Purchase History
| Date | Buyer | Sale Price | Title Company |
|---|---|---|---|
| Jonoubei Rodney | -- | Old Republic Title Company | |
| Jonoubei Rodney | -- | Alliance Title Company | |
| Jonoubei Rodney | $210,000 | Alliance Title Company | |
| Jonoubei San | -- | -- |
Source: Public Records
Mortgage History
| Date | Status | Borrower | Loan Amount |
|---|---|---|---|
| Open | Jonoubei Rodney | $160,000 |
Source: Public Records
Tax History Compared to Growth
Tax History
| Year | Tax Paid | Tax Assessment Tax Assessment Total Assessment is a certain percentage of the fair market value that is determined by local assessors to be the total taxable value of land and additions on the property. | Land | Improvement |
|---|---|---|---|---|
| 2025 | $2,962 | $275,950 | $91,981 | $183,969 |
| 2024 | $2,906 | $270,540 | $90,178 | $180,362 |
| 2023 | $2,902 | $265,236 | $88,410 | $176,826 |
| 2022 | $2,865 | $260,036 | $86,677 | $173,359 |
| 2021 | $2,823 | $254,938 | $84,978 | $169,960 |
| 2020 | $2,804 | $252,325 | $84,107 | $168,218 |
| 2019 | $2,757 | $247,378 | $82,458 | $164,920 |
| 2018 | $2,754 | $242,529 | $80,842 | $161,687 |
| 2017 | $2,690 | $237,774 | $79,257 | $158,517 |
| 2016 | $2,512 | $233,112 | $77,703 | $155,409 |
| 2015 | $2,491 | $229,611 | $76,536 | $153,075 |
| 2014 | $2,467 | $225,114 | $75,037 | $150,077 |
Source: Public Records
Map
Nearby Homes
- 2700 Oxford Ave
- 2985 Radford Way
- 3076 Radford Way
- 1321 Trinity Way
- 3117 Andre Ln
- 2417 Andre Ln
- 517 W Tuolumne Rd
- 2300 Dels Ln
- 2213 Dels Ln
- 2900 Andre Ln Unit 241
- 2900 Andre Ln Unit 237
- 2905 Niagra St Unit 168
- 401 W Tuolumne Rd
- 2821 Messenger Ct
- 3723 Honeycreeper Dr
- 1883 Ethan Allen Ct
- 330 Wiley Ct
- 3300 Spring Garden Dr
- 125 Hedstrom Rd
- 2101 State St
- 902 Gettysburg St
- 932 Gettysburg St
- 921 Georgetown Ave
- 901 Georgetown Ave
- 931 Georgetown Ave
- 882 Gettysburg St
- 942 Gettysburg St
- 923 Gettysburg St
- 881 Georgetown Ave
- 903 Gettysburg St
- 933 Gettysburg St
- 941 Georgetown Ave
- 862 Gettysburg St
- 962 Gettysburg St
- 883 Gettysburg St
- 861 Georgetown Ave
- 961 Georgetown Ave
- 863 Gettysburg St
- 842 Gettysburg St
- 982 Gettysburg St