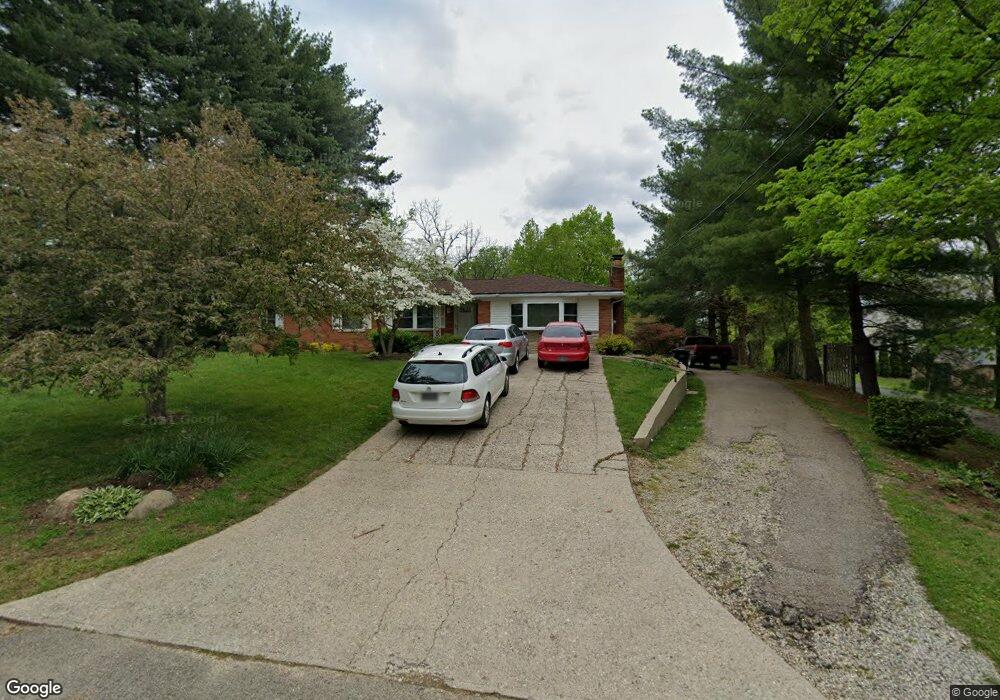
922 Locust Ln Cincinnati, OH 45245
Estimated Value: $208,000 - $310,000
4
Beds
2
Baths
1,816
Sq Ft
$150/Sq Ft
Est. Value
About This Home
This home is located at 922 Locust Ln, Cincinnati, OH 45245 and is currently estimated at $272,808, approximately $150 per square foot. 922 Locust Ln is a home located in Clermont County with nearby schools including Summerside Elementary School, West Clermont Middle School, and West Clermont High School.
Ownership History
Date
Name
Owned For
Owner Type
Purchase Details
Closed on
Oct 24, 2007
Sold by
Bank Of New York
Bought by
Galarde William A and Galarde Amy
Current Estimated Value
Home Financials for this Owner
Home Financials are based on the most recent Mortgage that was taken out on this home.
Original Mortgage
$22,475
Outstanding Balance
$14,350
Interest Rate
6.47%
Mortgage Type
Stand Alone Second
Estimated Equity
$258,458
Purchase Details
Closed on
May 15, 2007
Sold by
Iredale Kenneth G
Bought by
Bank Of New York
Purchase Details
Closed on
May 28, 2003
Sold by
Evans Daniel R and Evans Diane L
Bought by
Iredale Kenneth G and Iredale Patricia A
Home Financials for this Owner
Home Financials are based on the most recent Mortgage that was taken out on this home.
Original Mortgage
$114,000
Interest Rate
5.9%
Mortgage Type
Purchase Money Mortgage
Purchase Details
Closed on
Sep 1, 1987
Create a Home Valuation Report for This Property
The Home Valuation Report is an in-depth analysis detailing your home's value as well as a comparison with similar homes in the area
Purchase History
| Date | Buyer | Sale Price | Title Company |
|---|---|---|---|
| Galarde William A | $89,900 | Attorney | |
| Bank Of New York | $96,666 | None Available | |
| Iredale Kenneth G | $120,000 | Technetitle Agency Inc | |
| -- | $79,900 | -- |
Source: Public Records
Mortgage History
| Date | Status | Borrower | Loan Amount |
|---|---|---|---|
| Open | Galarde William A | $22,475 | |
| Open | Galarde William A | $67,425 | |
| Previous Owner | Iredale Kenneth G | $114,000 |
Source: Public Records
Tax History
| Year | Tax Paid | Tax Assessment Tax Assessment Total Assessment is a certain percentage of the fair market value that is determined by local assessors to be the total taxable value of land and additions on the property. | Land | Improvement |
|---|---|---|---|---|
| 2024 | $3,417 | $67,760 | $11,410 | $56,350 |
| 2023 | $3,423 | $67,760 | $11,410 | $56,350 |
| 2022 | $3,174 | $54,460 | $9,100 | $45,360 |
| 2021 | $3,187 | $54,460 | $9,100 | $45,360 |
| 2020 | $3,190 | $54,460 | $9,100 | $45,360 |
| 2019 | $2,299 | $45,890 | $12,180 | $33,710 |
| 2018 | $2,322 | $45,890 | $12,180 | $33,710 |
| 2017 | $2,211 | $45,890 | $12,180 | $33,710 |
| 2016 | $2,211 | $39,550 | $10,500 | $29,050 |
| 2015 | $2,206 | $39,550 | $10,500 | $29,050 |
| 2014 | $2,206 | $39,550 | $10,500 | $29,050 |
| 2013 | $2,308 | $40,920 | $9,800 | $31,120 |
Source: Public Records
Map
Nearby Homes
- 4625 Locust Grove Ct
- 4573 Northcross Ct
- 4322 Preston Place
- 4746 Shephard Rd
- 4575 Foxfire Ln
- 1023 Glendale Dr
- 4565 Shephard Rd
- 14 Tidewater Trace Unit 2207
- 4583 Creekwood Ct
- 2 Spotswood Common Unit 2006
- 4622 Muirridge Ct
- 34 Banberry Trace Unit 1605
- 4686 Tealtown Rd
- 4493 Schoolhouse Rd
- 598 Dedication Ln
- 4488 Glenwillow Dr
- 1178 Mckinley Ct
- 1079 Kensington Ln
- 1069 Crisfield Dr
- 634 Chateau Dr
Your Personal Tour Guide
Ask me questions while you tour the home.