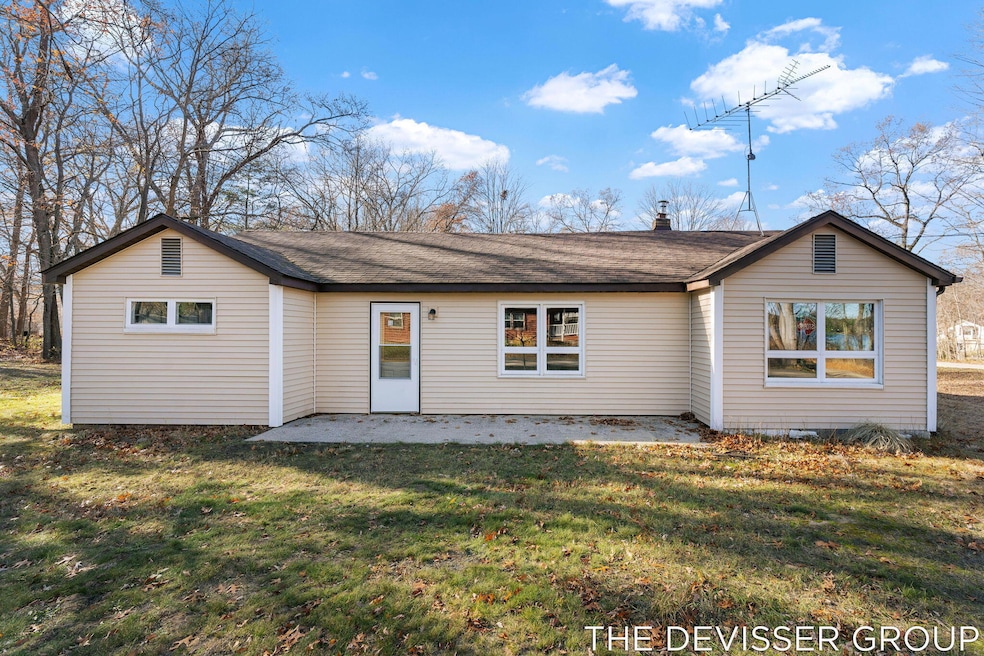
922 Maas Ln Pullman, MI 49450
Estimated payment $1,386/month
Highlights
- Lake Front
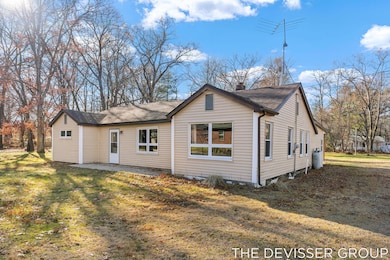
- Corner Lot
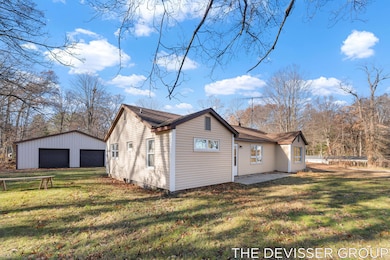
- 2 Car Detached Garage
- Water Access
- No HOA
- Cooling Available
About This Home
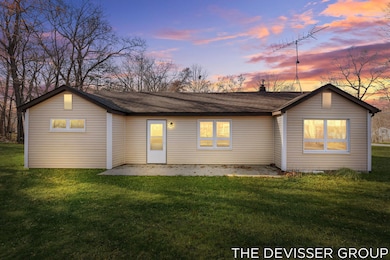
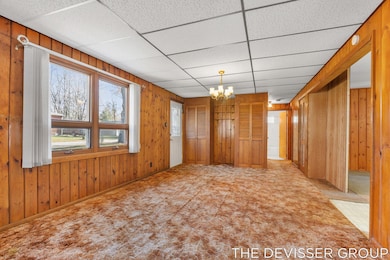
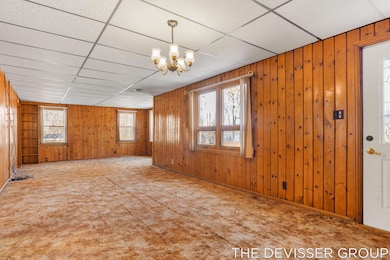
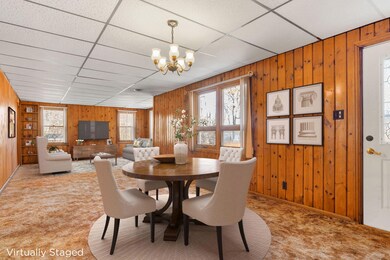
Embrace lake-area living with this cozy cottage just moments from the public boat launch. All the major updates are already done such as new roof, new siding, new furnace, and new water heater. This just means you have the perfect canvas to add your personal touch on the fun stuff! Imagine fresh paint, new flooring, and your design transforming this space into the getaway or full-time retreat you've been dreaming of. Sitting on just under an acre with beautiful water views and an oversized two-stall garage, this property also features potential land splits for added opportunity. A unique mix of charm, functionality, and flexibility! Easy access to I-96 highway.
Listing Agent
City2Shore Real Estate Holland License #6501393498 Listed on: 11/19/2025
Home Details
Home Type
- Single Family
Est. Annual Taxes
- $1,893
Year Built
- Built in 1950
Lot Details
- 41,818 Sq Ft Lot
- Lot Dimensions are 237x231x108x108x123x111
- Lake Front
- Corner Lot
- Level Lot
Parking
- 2 Car Detached Garage
- Gravel Driveway
- Unpaved Parking
Home Design
- Slab Foundation
- Asphalt Roof
- Vinyl Siding
Interior Spaces
- 1,396 Sq Ft Home
- 1-Story Property
- Linoleum Flooring
- Water Views
- Partial Basement
- Laundry on lower level
Kitchen
- Oven
- Range
- Dishwasher
Bedrooms and Bathrooms
- 3 Main Level Bedrooms
- 1 Full Bathroom
Outdoor Features
- Water Access
Utilities
- Cooling Available
- Forced Air Heating System
- Heating System Uses Oil
- Window Unit Heating System
- Baseboard Heating
- Well
- Electric Water Heater
- Septic Tank
Community Details
- No Home Owners Association
Map
Tax History
| Year | Tax Paid | Tax Assessment Tax Assessment Total Assessment is a certain percentage of the fair market value that is determined by local assessors to be the total taxable value of land and additions on the property. | Land | Improvement |
|---|---|---|---|---|
| 2025 | $1,893 | $86,400 | $12,700 | $73,700 |
| 2024 | $1,435 | $80,000 | $6,500 | $73,500 |
| 2023 | $1,435 | $86,800 | $6,500 | $80,300 |
| 2022 | $1,435 | $65,600 | $5,800 | $59,800 |
| 2020 | $1,499 | $46,600 | $5,200 | $41,400 |
| 2019 | $1,425 | $41,600 | $5,200 | $36,400 |
| 2018 | $0 | $46,400 | $5,200 | $41,200 |
| 2017 | $0 | $48,600 | $5,200 | $43,400 |
| 2016 | $0 | $32,800 | $4,800 | $28,000 |
| 2015 | -- | $32,800 | $4,800 | $28,000 |
| 2014 | -- | $33,800 | $4,800 | $29,000 |
| 2013 | -- | $33,200 | $4,800 | $28,400 |
Property History
| Date | Event | Price | List to Sale | Price per Sq Ft |
|---|---|---|---|---|
| 04/01/2026 04/01/26 | Pending | -- | -- | -- |
| 11/19/2025 11/19/25 | For Sale | $230,000 | -- | $165 / Sq Ft |
Purchase History
| Date | Type | Sale Price | Title Company |
|---|---|---|---|
| Interfamily Deed Transfer | -- | None Available | |
| Quit Claim Deed | -- | Attorney | |
| Interfamily Deed Transfer | -- | Attorney | |
| Quit Claim Deed | -- | Attorney | |
| Interfamily Deed Transfer | -- | Attorney | |
| Interfamily Deed Transfer | -- | Attorney | |
| Interfamily Deed Transfer | -- | None Available |
Source: MichRIC
MLS Number: 25059059
APN: 12-730-017-00
Disclaimer: Certain information contained herein is derived from information provided by parties other than Homes.com. All information provided is deemed reliable, but is not guaranteed to be accurate and should be independently verified.
![]() Information is deemed reliable but not guaranteed.
Information is deemed reliable but not guaranteed.
Copyright 2026 MichRIC, LLC. All rights reserved.

Ask me questions while you tour the home.