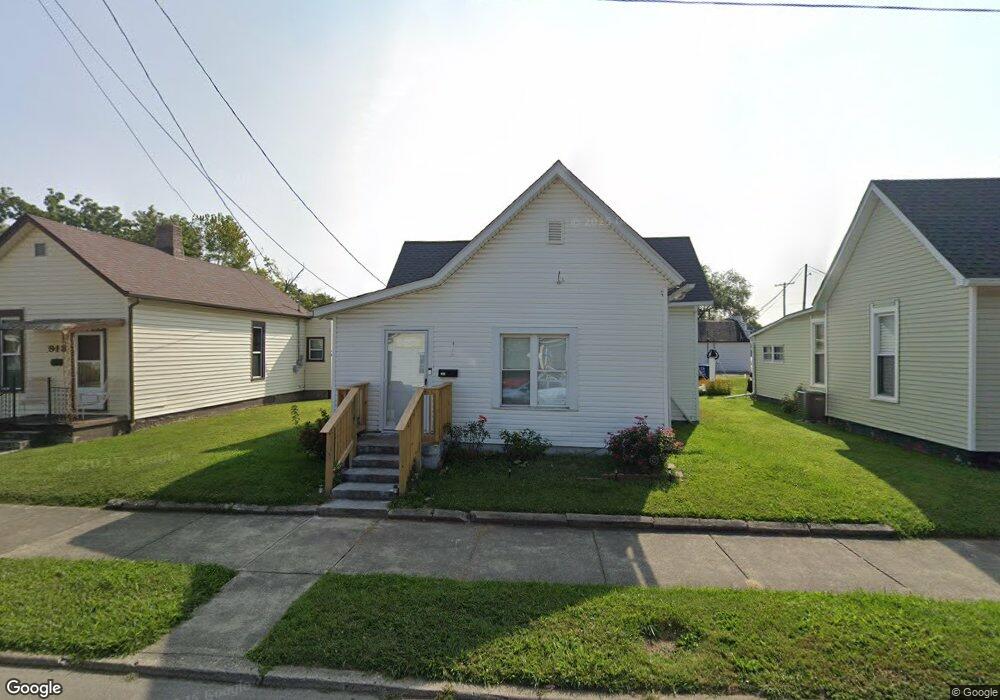
922 Meridian St Shelbyville, IN 46176
Estimated Value: $143,000 - $172,120
2
Beds
1
Bath
1,365
Sq Ft
$115/Sq Ft
Est. Value
About This Home
This home is located at 922 Meridian St, Shelbyville, IN 46176 and is currently estimated at $157,030, approximately $115 per square foot. 922 Meridian St is a home located in Shelby County with nearby schools including Thomas A. Hendricks Elementary School, Shelbyville Middle School, and Shelbyville Senior High School.
Ownership History
Date
Name
Owned For
Owner Type
Purchase Details
Closed on
Jul 28, 2025
Sold by
Rojas Olivia and Mulato Daniel Viera
Bought by
Mulato Daniel Viera
Current Estimated Value
Purchase Details
Closed on
May 23, 2022
Sold by
Olivia Rojas
Bought by
Rojas Olivia and Mulato Daniel Viera
Purchase Details
Closed on
Jan 13, 2010
Sold by
Lopez Velazquez Jose Antonio
Bought by
Rojas Olivia
Purchase Details
Closed on
Nov 7, 2008
Sold by
Citimortgage Inc
Bought by
Secretary Of Hud
Purchase Details
Closed on
Aug 1, 2008
Sold by
Jenkins Aaron D
Bought by
Citimortgage Inc
Purchase Details
Closed on
Oct 13, 2005
Sold by
Rasner William B
Bought by
Jenkins Aaron D
Home Financials for this Owner
Home Financials are based on the most recent Mortgage that was taken out on this home.
Original Mortgage
$74,333
Interest Rate
5.83%
Mortgage Type
FHA
Create a Home Valuation Report for This Property
The Home Valuation Report is an in-depth analysis detailing your home's value as well as a comparison with similar homes in the area
Home Values in the Area
Average Home Value in this Area
Purchase History
| Date | Buyer | Sale Price | Title Company |
|---|---|---|---|
| Mulato Daniel Viera | -- | Near North Title Group | |
| Rojas Olivia | -- | New Title Company Name | |
| Rojas Olivia | -- | -- | |
| Secretary Of Hud | -- | -- | |
| Citimortgage Inc | -- | -- | |
| Jenkins Aaron D | -- | -- | |
| Rasner William B | -- | -- |
Source: Public Records
Mortgage History
| Date | Status | Borrower | Loan Amount |
|---|---|---|---|
| Previous Owner | Jenkins Aaron D | $74,333 |
Source: Public Records
Tax History Compared to Growth
Tax History
| Year | Tax Paid | Tax Assessment Tax Assessment Total Assessment is a certain percentage of the fair market value that is determined by local assessors to be the total taxable value of land and additions on the property. | Land | Improvement |
|---|---|---|---|---|
| 2024 | $873 | $97,800 | $9,600 | $88,200 |
| 2023 | $785 | $94,900 | $9,300 | $85,600 |
| 2022 | $866 | $92,100 | $9,100 | $83,000 |
| 2021 | $559 | $74,500 | $9,100 | $65,400 |
| 2020 | $547 | $74,200 | $9,100 | $65,100 |
| 2019 | $502 | $67,600 | $8,600 | $59,000 |
| 2018 | $474 | $62,700 | $8,600 | $54,100 |
| 2017 | $552 | $73,900 | $8,600 | $65,300 |
| 2016 | $539 | $72,300 | $8,400 | $63,900 |
| 2014 | $495 | $69,700 | $8,100 | $61,600 |
| 2013 | $495 | $69,700 | $8,100 | $61,600 |
Source: Public Records
Map
Nearby Homes
- 1051 Meridian St
- 120 1st St
- 1101 S Shelby St
- 700 E South St
- 629 S Miller St
- 430 W Locust St
- 41 Grissom Ln
- 34 Mildred St
- 755 2nd St
- 217 Howard St
- 201 W Hendricks St
- 1103 Fairfield Dr
- 842 Miller Ave
- 410 Howard St
- LT2 Hascuster Ln
- 232 W Broadway St
- LT4 Hasecuster Ln
- LT3 Hasecuster Ln
- 233 W Jackson St
- 316 W Broadway St
- 918 Meridian St
- 926 Meridian St
- 914 Meridian St
- 910 Meridian St
- 873 S Tompkins St
- 921 Meridian St
- 917 Meridian St
- 869 S Tompkins St
- 925 Meridian St
- 906 Meridian St
- 913 Meridian St
- 865 S Tompkins St
- 879 S Tompkins St
- 909 Meridian St Unit SST
- 401 2nd St
- 904 Meridian St
- 861 S Tompkins St
- 905 Meridian St
- 903 Meridian St
- 856 Meridian St