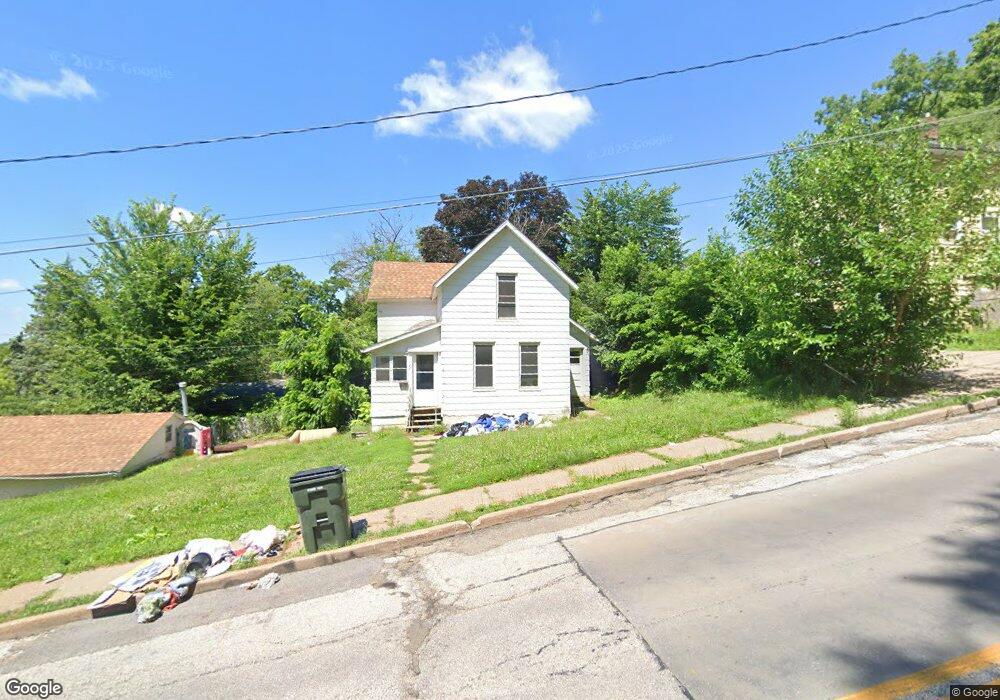
922 N Fillmore St Davenport, IA 52804
Riverview Terrace NeighborhoodEstimated Value: $49,000 - $125,000
2
Beds
1
Bath
872
Sq Ft
$94/Sq Ft
Est. Value
About This Home
This home is located at 922 N Fillmore St, Davenport, IA 52804 and is currently estimated at $82,399, approximately $94 per square foot. 922 N Fillmore St is a home located in Scott County with nearby schools including Walnut Hill Elementary School, South Christian Elementary School, and Christian County Middle School.
Ownership History
Date
Name
Owned For
Owner Type
Purchase Details
Closed on
Aug 27, 2025
Sold by
Sountris Troy E and Sountris Monica
Bought by
Domino Enterprises Llc
Current Estimated Value
Purchase Details
Closed on
Nov 1, 2024
Sold by
Sountris Vivan L and Sountris Kyle M
Bought by
Sountris Troy E
Purchase Details
Closed on
Jun 13, 2006
Sold by
U S Bank Na
Bought by
S & J Realty
Purchase Details
Closed on
Nov 1, 2005
Sold by
Thorndike Anita M
Bought by
Us Bank Na
Create a Home Valuation Report for This Property
The Home Valuation Report is an in-depth analysis detailing your home's value as well as a comparison with similar homes in the area
Home Values in the Area
Average Home Value in this Area
Purchase History
| Date | Buyer | Sale Price | Title Company |
|---|---|---|---|
| Domino Enterprises Llc | -- | None Listed On Document | |
| Sountris Troy E | -- | None Listed On Document | |
| S & J Realty | $21,000 | Title Services Corporation | |
| Us Bank Na | $37,500 | None Available |
Source: Public Records
Tax History Compared to Growth
Tax History
| Year | Tax Paid | Tax Assessment Tax Assessment Total Assessment is a certain percentage of the fair market value that is determined by local assessors to be the total taxable value of land and additions on the property. | Land | Improvement |
|---|---|---|---|---|
| 2025 | $1,066 | $66,310 | $10,130 | $56,180 |
| 2024 | $1,662 | $59,700 | $10,130 | $49,570 |
| 2023 | $1,602 | $59,700 | $10,130 | $49,570 |
| 2022 | $1,223 | $47,840 | $10,130 | $37,710 |
| 2021 | $1,026 | $47,840 | $10,130 | $37,710 |
| 2020 | $1,044 | $46,660 | $10,130 | $36,530 |
| 2019 | $976 | $43,520 | $10,130 | $33,390 |
| 2018 | $956 | $43,520 | $10,130 | $33,390 |
| 2017 | $242 | $43,520 | $10,130 | $33,390 |
| 2016 | $954 | $43,520 | $0 | $0 |
| 2015 | $954 | $38,600 | $0 | $0 |
| 2014 | $858 | $38,600 | $0 | $0 |
| 2013 | $842 | $0 | $0 | $0 |
| 2012 | -- | $40,820 | $6,960 | $33,860 |
Source: Public Records
Map
Nearby Homes