S
Landlord's Agent in 2025
Shannon Knott
Property Management Division of Busch Realty Group, LLC
(228) 224-3976
1 in this area
13 Total Sales


Estimated Value: $249,126 - $332,000
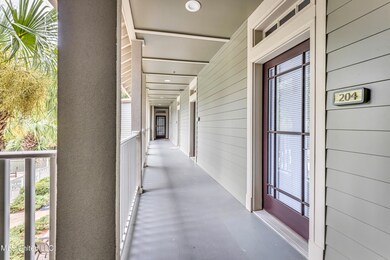
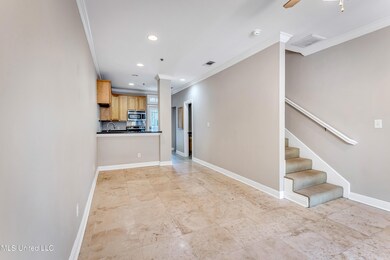
Location, location, location!!! This beautiful one bedroom one and a half bath condo is situated right in the heart of downtown Ocean Springs! Beautiful, open floor plan with high ceilings, granite counter tops, updated fixtures, beautiful tile flooring and a stackable washer/dryer. Just off the living room, a door leads you out to your private balcony overlooking Porter Ave. Imagine walking to the local shops, restaurants and venues. Enjoy all of the festivities from the comfort of your balcony! Amenities include a community pool, assigned, covered parking and a huge outside storage shed. Owner pays water, sewer and trash. Call or text today for your own private tour. This community has restrictive covenants.
Last Agent to Rent the Property
Property Management Division of Busch Realty Group, LLC License #S53782 Listed on: 08/02/2024
Co-Listed By
George Salter
Property Management Division of Busch Realty Group, LLC License #S54471
Last Renter's Agent
George Salter
Busch Realty Group, LLC
| Date | Buyer | Sale Price | Title Company |
|---|---|---|---|
| Hoekwater Zachery S | -- | None Available |
| Date | Status | Borrower | Loan Amount |
|---|---|---|---|
| Closed | Hoekwater Zachery S | $175,212 |
| Date | Event | Price | List to Sale | Price per Sq Ft |
|---|---|---|---|---|
| 04/28/2025 04/28/25 | Rented | $1,675 | 0.0% | -- |
| 04/21/2025 04/21/25 | Under Contract | -- | -- | -- |
| 01/27/2025 01/27/25 | Price Changed | $1,675 | -6.7% | $2 / Sq Ft |
| 10/18/2024 10/18/24 | Price Changed | $1,795 | -3.0% | $2 / Sq Ft |
| 09/30/2024 09/30/24 | Price Changed | $1,850 | -2.6% | $2 / Sq Ft |
| 08/02/2024 08/02/24 | For Rent | $1,900 | +2.7% | -- |
| 08/10/2023 08/10/23 | Rented | $1,850 | -7.5% | -- |
| 07/03/2023 07/03/23 | For Rent | $2,000 | 0.0% | -- |
| 07/12/2022 07/12/22 | Off Market | $2,000 | -- | -- |
| 07/11/2022 07/11/22 | Rented | $2,000 | 0.0% | -- |
| 06/22/2022 06/22/22 | For Rent | $2,000 | -- | -- |
| Year | Tax Paid | Tax Assessment Tax Assessment Total Assessment is a certain percentage of the fair market value that is determined by local assessors to be the total taxable value of land and additions on the property. | Land | Improvement |
|---|---|---|---|---|
| 2024 | $3,778 | $26,212 | $6,452 | $19,760 |
| 2023 | $3,778 | $26,212 | $6,452 | $19,760 |
| 2022 | $3,828 | $26,212 | $6,452 | $19,760 |
| 2021 | $4,200 | $29,174 | $0 | $0 |
| 2020 | $3,013 | $20,720 | $4,575 | $16,145 |
| 2019 | $3,002 | $20,720 | $4,575 | $16,145 |
| 2018 | $2,987 | $20,720 | $4,575 | $16,145 |
| 2017 | $2,987 | $20,720 | $4,575 | $16,145 |
| 2016 | $2,925 | $20,720 | $4,575 | $16,145 |
| 2015 | $2,989 | $138,530 | $32,500 | $106,030 |
| 2014 | $3,037 | $21,266 | $4,875 | $16,391 |
| 2013 | $2,968 | $21,266 | $4,875 | $16,391 |
S
Landlord's Agent in 2025
Shannon Knott
Property Management Division of Busch Realty Group, LLC
(228) 224-3976
1 in this area
13 Total Sales
G
Landlord's Co-Listing Agent in 2025
George Salter
Property Management Division of Busch Realty Group, LLC
K
Buyer's Agent in 2023
Kristi Ellis
ERA PowerMark Properties
K
Buyer's Agent in 2023
Kristi Ferguson
Century 21 Busch Realty Group
(228) 324-1715
5 in this area
66 Total Sales
Source: MLS United
MLS Number: 4087402
APN: 6-11-10-204.000
Disclaimer: Certain information contained herein is derived from information provided by parties other than Homes.com. All information provided is deemed reliable, but is not guaranteed to be accurate and should be independently verified.
![]() Information is deemed to be reliable but not guaranteed. Copyright 2025 MLS United, LLC.
Information is deemed to be reliable but not guaranteed. Copyright 2025 MLS United, LLC.
