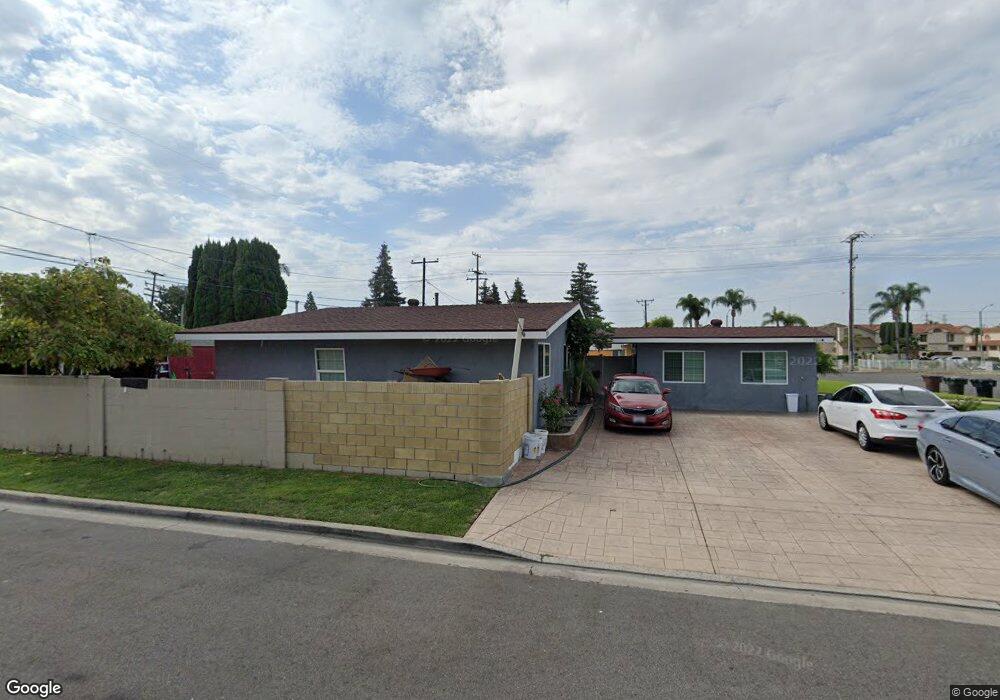
922 S Verona St Anaheim, CA 92804
West Anaheim NeighborhoodEstimated Value: $865,000 - $937,000
3
Beds
2
Baths
1,145
Sq Ft
$773/Sq Ft
Est. Value
About This Home
This home is located at 922 S Verona St, Anaheim, CA 92804 and is currently estimated at $884,828, approximately $772 per square foot. 922 S Verona St is a home located in Orange County with nearby schools including Mattie Lou Maxwell Elementary School, Dale Jr High School, and Magnolia High.
Ownership History
Date
Name
Owned For
Owner Type
Purchase Details
Closed on
Apr 16, 2018
Sold by
Soto Lionicio and Soto Virginia
Bought by
Zuniga Gustavo A
Current Estimated Value
Home Financials for this Owner
Home Financials are based on the most recent Mortgage that was taken out on this home.
Original Mortgage
$440,000
Outstanding Balance
$378,040
Interest Rate
4.4%
Mortgage Type
New Conventional
Estimated Equity
$506,788
Purchase Details
Closed on
Jul 28, 2004
Sold by
Fagin Robert R and Fagin Awilda R
Bought by
Soto Lionicio and Soto Virginia
Home Financials for this Owner
Home Financials are based on the most recent Mortgage that was taken out on this home.
Original Mortgage
$312,800
Interest Rate
5.76%
Mortgage Type
New Conventional
Purchase Details
Closed on
Jun 20, 2002
Sold by
Fagin Robert R and Fagin Awilda R
Bought by
Fagin Robert R and Fagin Awilda R
Create a Home Valuation Report for This Property
The Home Valuation Report is an in-depth analysis detailing your home's value as well as a comparison with similar homes in the area
Home Values in the Area
Average Home Value in this Area
Purchase History
| Date | Buyer | Sale Price | Title Company |
|---|---|---|---|
| Zuniga Gustavo A | $550,000 | Provident Title Co | |
| Soto Lionicio | $391,000 | Lawyers Title Company | |
| Fagin Robert R | -- | -- |
Source: Public Records
Mortgage History
| Date | Status | Borrower | Loan Amount |
|---|---|---|---|
| Open | Zuniga Gustavo A | $440,000 | |
| Previous Owner | Soto Lionicio | $312,800 | |
| Closed | Soto Lionicio | $78,200 |
Source: Public Records
Tax History Compared to Growth
Tax History
| Year | Tax Paid | Tax Assessment Tax Assessment Total Assessment is a certain percentage of the fair market value that is determined by local assessors to be the total taxable value of land and additions on the property. | Land | Improvement |
|---|---|---|---|---|
| 2025 | $7,763 | $681,548 | $561,512 | $120,036 |
| 2024 | $7,763 | $668,185 | $550,502 | $117,683 |
| 2023 | $7,563 | $655,084 | $539,708 | $115,376 |
| 2022 | $7,491 | $642,240 | $529,126 | $113,114 |
| 2021 | $6,838 | $578,148 | $518,751 | $59,397 |
| 2020 | $6,665 | $572,220 | $513,432 | $58,788 |
| 2019 | $6,497 | $561,000 | $503,364 | $57,636 |
| 2018 | $5,638 | $479,239 | $421,743 | $57,496 |
| 2017 | $5,438 | $469,843 | $413,474 | $56,369 |
| 2016 | $5,413 | $460,631 | $405,367 | $55,264 |
| 2015 | $4,961 | $417,000 | $368,167 | $48,833 |
| 2014 | $4,350 | $375,000 | $326,167 | $48,833 |
Source: Public Records
Map
Nearby Homes
- 837 S Magnolia Ave
- 8921 Kennelly Ln
- 2517 W Merle Place
- 927 S Webster Ave
- 1234 S Macduff St
- 1223 S Dale Ave
- 2631 W Cerritos Ave
- 507 S Shields Dr
- 2550 W Rowland Ave
- 9272 Cerritos Ave
- 9542 Chanticleer Rd
- 9155 Pacific Ave Unit 265
- 998 S Crossbow Ln Unit 12D
- 958 S Crossbow Ln Unit 8
- 2513 W Fulcrum Place
- 10301 Rhiems Rd
- 2435 W Broadway
- 2513 W Mall Place
- 134 S Magnolia Ave Unit 4C
- 917 S Sutter Creek Rd Unit 46
- 926 S Verona St
- 914 S Verona St
- 923 S Kenmore St
- 927 S Kenmore St
- 930 S Verona St
- 915 S Kenmore St
- 923 S Verona St
- 931 S Kenmore St
- 910 S Verona St
- 927 S Verona St
- 915 S Verona St
- 911 S Kenmore St
- 931 S Verona St
- 906 S Verona St
- 911 S Verona St
- 907 S Kenmore St
- 922 S Kenmore St
- 922 S Sylvan St
- 926 S Sylvan St
- 907 S Verona St