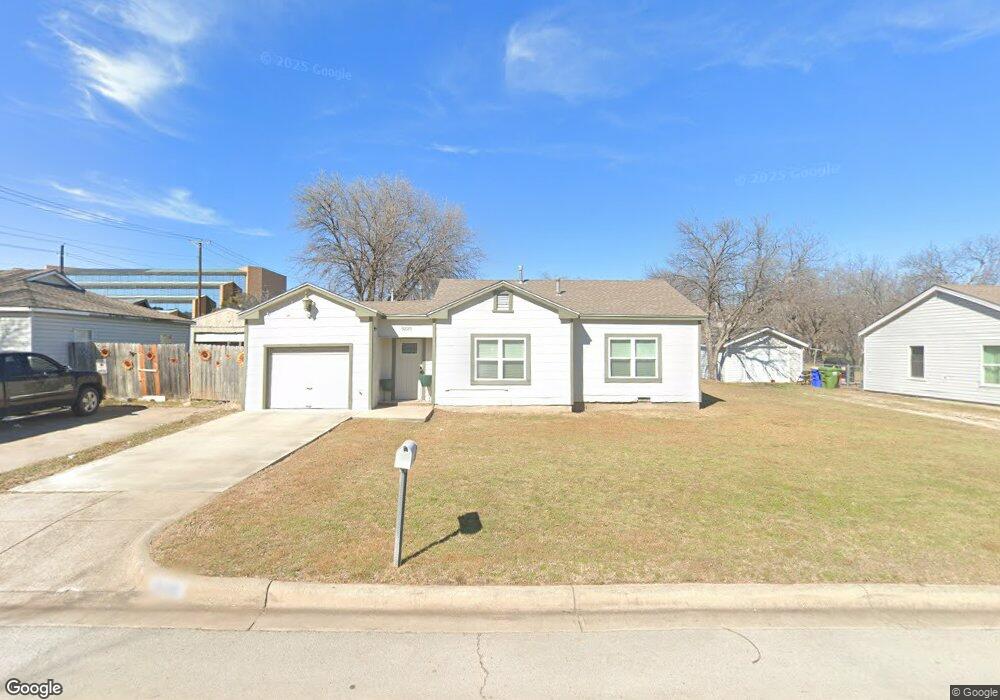
9220 Oels St Fort Worth, TX 76108
Estimated Value: $162,000 - $176,663
2
Beds
1
Bath
756
Sq Ft
$224/Sq Ft
Est. Value
About This Home
This home is located at 9220 Oels St, Fort Worth, TX 76108 and is currently estimated at $169,166, approximately $223 per square foot. 9220 Oels St is a home located in Tarrant County with nearby schools including West Elementary School, Brewer Middle School, and Tannahill Intermediate School.
Ownership History
Date
Name
Owned For
Owner Type
Purchase Details
Closed on
Dec 21, 2018
Sold by
Jlp Property Rentals Llc
Bought by
Gomez Ema
Current Estimated Value
Home Financials for this Owner
Home Financials are based on the most recent Mortgage that was taken out on this home.
Original Mortgage
$50,000
Interest Rate
4.9%
Mortgage Type
Purchase Money Mortgage
Purchase Details
Closed on
Mar 7, 2011
Sold by
Jlp Properties Inc
Bought by
Jlp Property Rentals Llc
Purchase Details
Closed on
Sep 27, 2010
Sold by
Hutsell Howard Lee and Hutsell Frances Carlene
Bought by
Jlp Properties Inc
Home Financials for this Owner
Home Financials are based on the most recent Mortgage that was taken out on this home.
Original Mortgage
$21,250
Interest Rate
4.46%
Mortgage Type
Purchase Money Mortgage
Create a Home Valuation Report for This Property
The Home Valuation Report is an in-depth analysis detailing your home's value as well as a comparison with similar homes in the area
Home Values in the Area
Average Home Value in this Area
Purchase History
| Date | Buyer | Sale Price | Title Company |
|---|---|---|---|
| Gomez Ema | -- | Fidelity National Title | |
| Jlp Property Rentals Llc | -- | None Available | |
| Jlp Properties Inc | -- | Rattikin Title |
Source: Public Records
Mortgage History
| Date | Status | Borrower | Loan Amount |
|---|---|---|---|
| Previous Owner | Gomez Ema | $50,000 | |
| Previous Owner | Jlp Properties Inc | $21,250 | |
| Closed | Jlp Property Rentals Llc | $0 |
Source: Public Records
Tax History Compared to Growth
Tax History
| Year | Tax Paid | Tax Assessment Tax Assessment Total Assessment is a certain percentage of the fair market value that is determined by local assessors to be the total taxable value of land and additions on the property. | Land | Improvement |
|---|---|---|---|---|
| 2025 | $1,230 | $163,052 | $50,550 | $112,502 |
| 2024 | $1,230 | $163,052 | $50,550 | $112,502 |
| 2023 | $2,445 | $167,970 | $50,550 | $117,420 |
| 2022 | $2,532 | $125,692 | $25,000 | $100,692 |
| 2021 | $2,338 | $85,000 | $25,000 | $60,000 |
| 2020 | $2,290 | $82,648 | $25,000 | $57,648 |
| 2019 | $2,585 | $89,863 | $25,000 | $64,863 |
| 2018 | $1,392 | $48,405 | $12,000 | $36,405 |
| 2017 | $1,415 | $48,405 | $12,000 | $36,405 |
| 2016 | $1,934 | $66,171 | $12,000 | $54,171 |
| 2015 | $853 | $29,700 | $12,400 | $17,300 |
| 2014 | $853 | $29,700 | $12,400 | $17,300 |
Source: Public Records
Map
Nearby Homes
- 9200 Farmers Rd
- 9221 White Settlement Rd
- 2860 Fox Trail Ln
- 10937 Elata Dr
- 9100 Rowland Dr
- 9104 White Settlement Rd
- 204 Lanham Ct
- 201 N Normandale St
- 641 S Redford Ln
- 428 S Las Vegas Trail
- 405 S Las Vegas Trail
- 407 S Las Vegas Trail
- 409 S Las Vegas Trail
- 411 S Las Vegas Trail
- 508 Grant Cir
- 105 Lockwood St
- 501 Allencrest Dr
- 8528 Pemberton Ct
- 9201 Clifford St
- 308 Hallvale Dr