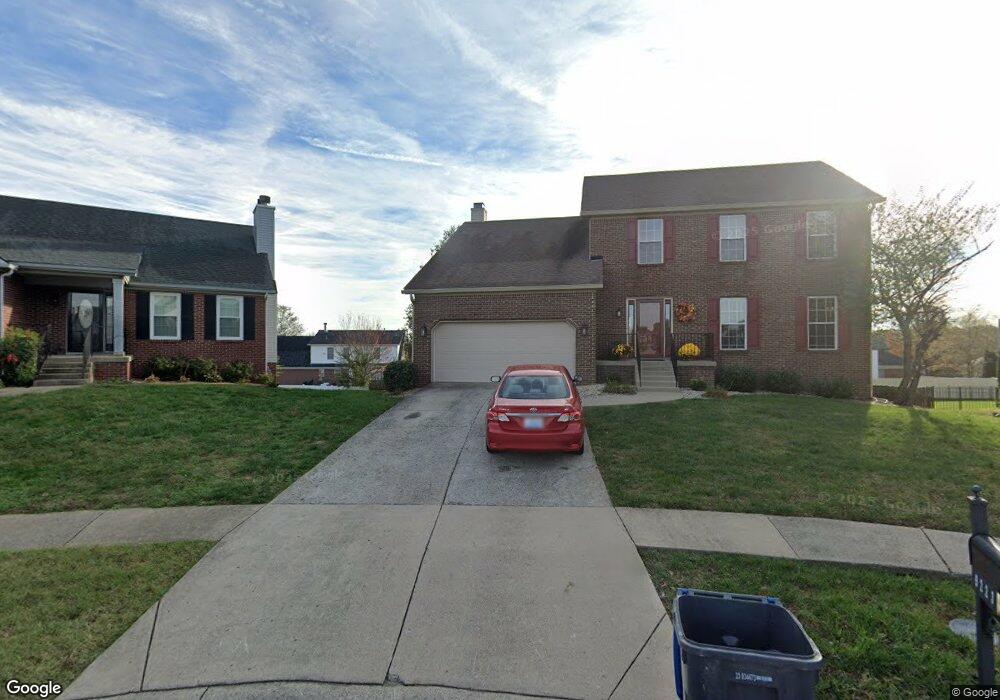
9223 Wellington Hill Ct Louisville, KY 40291
Estimated Value: $344,000 - $403,976
4
Beds
3
Baths
3,216
Sq Ft
$116/Sq Ft
Est. Value
About This Home
This home is located at 9223 Wellington Hill Ct, Louisville, KY 40291 and is currently estimated at $374,494, approximately $116 per square foot. 9223 Wellington Hill Ct is a home located in Jefferson County with nearby schools including Wilt Elementary School, Fern Creek Elementary School, and Bates Elementary School.
Ownership History
Date
Name
Owned For
Owner Type
Purchase Details
Closed on
May 16, 2025
Sold by
Jones Heather L and Jones Kenneth D
Bought by
David Wayne Aikens Living Trust and Aikens
Current Estimated Value
Purchase Details
Closed on
Jun 25, 2010
Sold by
Hsbc Bank Usa National Association
Bought by
Jones Kenneth D and Jones Heather L
Home Financials for this Owner
Home Financials are based on the most recent Mortgage that was taken out on this home.
Original Mortgage
$138,000
Interest Rate
4.83%
Mortgage Type
New Conventional
Purchase Details
Closed on
Nov 30, 2009
Sold by
Withers Rosalind
Bought by
Hsbc Bank Usa National Association
Purchase Details
Closed on
Apr 24, 2006
Sold by
Taylor Donald E and Taylor Karolyn L
Bought by
Withers Rosalind
Home Financials for this Owner
Home Financials are based on the most recent Mortgage that was taken out on this home.
Original Mortgage
$174,400
Interest Rate
8.65%
Mortgage Type
Fannie Mae Freddie Mac
Create a Home Valuation Report for This Property
The Home Valuation Report is an in-depth analysis detailing your home's value as well as a comparison with similar homes in the area
Home Values in the Area
Average Home Value in this Area
Purchase History
| Date | Buyer | Sale Price | Title Company |
|---|---|---|---|
| David Wayne Aikens Living Trust | $348,925 | None Listed On Document | |
| Jones Kenneth D | $172,500 | Accutitle | |
| Hsbc Bank Usa National Association | $160,000 | None Available | |
| Withers Rosalind | $204,500 | Area Title |
Source: Public Records
Mortgage History
| Date | Status | Borrower | Loan Amount |
|---|---|---|---|
| Previous Owner | Jones Kenneth D | $138,000 | |
| Previous Owner | Withers Rosalind | $174,400 |
Source: Public Records
Tax History Compared to Growth
Tax History
| Year | Tax Paid | Tax Assessment Tax Assessment Total Assessment is a certain percentage of the fair market value that is determined by local assessors to be the total taxable value of land and additions on the property. | Land | Improvement |
|---|---|---|---|---|
| 2024 | $3,196 | $279,150 | $40,000 | $239,150 |
| 2023 | $3,288 | $279,150 | $40,000 | $239,150 |
| 2022 | $3,300 | $211,830 | $46,000 | $165,830 |
| 2021 | $2,679 | $211,830 | $46,000 | $165,830 |
| 2020 | $2,493 | $211,830 | $46,000 | $165,830 |
| 2019 | $2,296 | $211,830 | $46,000 | $165,830 |
| 2018 | $2,268 | $211,830 | $46,000 | $165,830 |
| 2017 | $2,223 | $211,830 | $46,000 | $165,830 |
| 2013 | $2,045 | $204,500 | $37,000 | $167,500 |
Source: Public Records
Map
Nearby Homes
- 7500 Warrenton Hill Ct
- 7617 Fair Ln
- 7520 Warrenton Hill Ct
- 7903 Moss Green Way
- 9532 Bayberry Green Ln
- 7901 Fir Green Way
- 6901 Holly Lake Dr
- 8013 Hunter Green Way
- 9415 Bayberry Green Ln Unit 1504
- 8000 Aspen Green Ln
- 9033 Sidney Way
- 8002 Magnolia Ridge Ct Unit 104
- 8002 Magnolia Ridge Ct Unit 203
- 8702 Mckenna Way
- 8720 Running Fox Cir
- 6807 Lake Elkhorn Ct
- 6803 Lake Elkhorn Ct
- 8601 Gamekeeper Ct
- 8418 Glaser Ln
- 7700 Johnson School Rd
- 9224 Wellington Hill Ct
- 9311 Artis Way Unit LOT 92
- 9221 Wellington Hill Ct
- 9309 Artis Way
- 9313 Artis Way
- 9222 Wellington Hill Ct
- 9307 Artis Way
- 9219 Wellington Hill Ct
- 9315 Artis Way
- 9220 Wellington Hill Ct
- 9217 Wellington Hill Ct
- 9219 Artis Way
- 9221 Artis Way
- 9303 Artis Way
- 9303 Artis Way Unit LOT 95
- 9217 Artis Way
- 9317 Artis Way
- 7403 Warrenton Hill Ct
- 9215 Wellington Hill Ct
- 9215 Artis Way