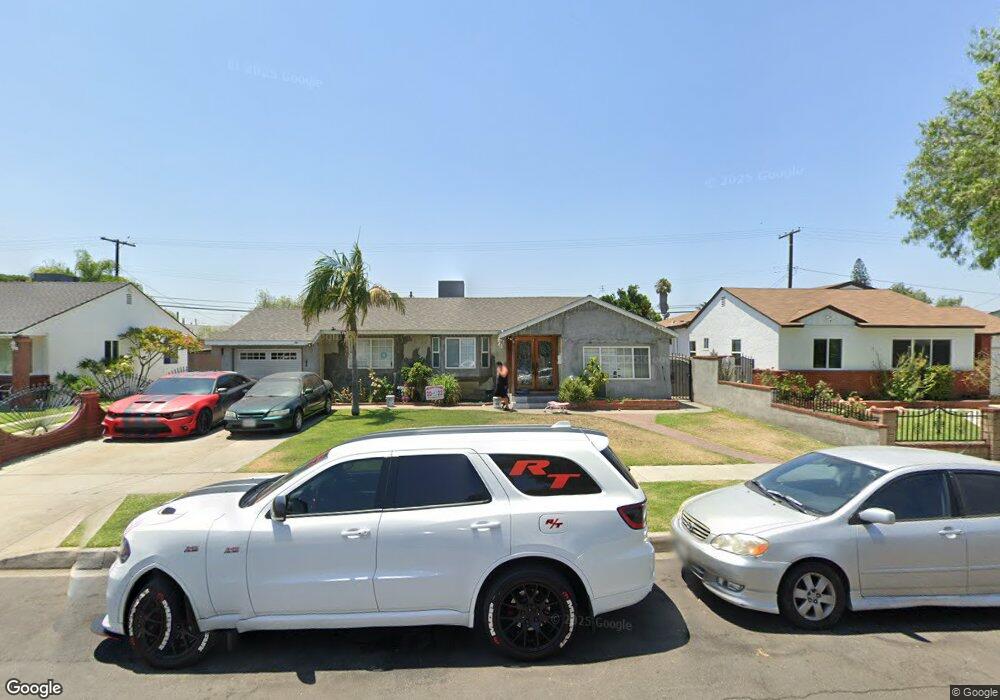
9224 Canford St Pico Rivera, CA 90660
Estimated Value: $721,000 - $773,000
3
Beds
1
Bath
1,441
Sq Ft
$521/Sq Ft
Est. Value
About This Home
This home is located at 9224 Canford St, Pico Rivera, CA 90660 and is currently estimated at $751,318, approximately $521 per square foot. 9224 Canford St is a home located in Los Angeles County with nearby schools including Rivera Elementary School, El Rancho High School, and Ruben Salazar Continuation School.
Ownership History
Date
Name
Owned For
Owner Type
Purchase Details
Closed on
Jun 5, 2013
Sold by
Evola Leo
Bought by
Plascencia Juan
Current Estimated Value
Purchase Details
Closed on
Sep 9, 2004
Sold by
Washington Mutual Bank Fa
Bought by
Evola Leo and Plascencia Juan
Home Financials for this Owner
Home Financials are based on the most recent Mortgage that was taken out on this home.
Original Mortgage
$208,000
Outstanding Balance
$101,946
Interest Rate
5.72%
Mortgage Type
Stand Alone First
Estimated Equity
$649,372
Purchase Details
Closed on
Jul 17, 1997
Sold by
Urias Ana C
Bought by
Great Western Bank Fsb
Purchase Details
Closed on
Aug 17, 1995
Sold by
Urias Ana C
Bought by
Urias Ana C
Home Financials for this Owner
Home Financials are based on the most recent Mortgage that was taken out on this home.
Original Mortgage
$25,000
Interest Rate
7.62%
Create a Home Valuation Report for This Property
The Home Valuation Report is an in-depth analysis detailing your home's value as well as a comparison with similar homes in the area
Home Values in the Area
Average Home Value in this Area
Purchase History
| Date | Buyer | Sale Price | Title Company |
|---|---|---|---|
| Plascencia Juan | -- | None Available | |
| Evola Leo | $260,000 | Fidelity National Title Comp | |
| Great Western Bank Fsb | $101,500 | Stewart Title | |
| Urias Ana C | -- | -- |
Source: Public Records
Mortgage History
| Date | Status | Borrower | Loan Amount |
|---|---|---|---|
| Open | Evola Leo | $208,000 | |
| Previous Owner | Urias Ana C | $25,000 |
Source: Public Records
Tax History Compared to Growth
Tax History
| Year | Tax Paid | Tax Assessment Tax Assessment Total Assessment is a certain percentage of the fair market value that is determined by local assessors to be the total taxable value of land and additions on the property. | Land | Improvement |
|---|---|---|---|---|
| 2025 | $5,477 | $378,050 | $296,153 | $81,897 |
| 2024 | $5,477 | $370,639 | $290,347 | $80,292 |
| 2023 | $5,328 | $363,372 | $284,654 | $78,718 |
| 2022 | $5,090 | $356,248 | $279,073 | $77,175 |
| 2021 | $4,968 | $349,263 | $273,601 | $75,662 |
| 2019 | $4,939 | $338,906 | $265,487 | $73,419 |
| 2018 | $4,688 | $332,262 | $260,282 | $71,980 |
| 2016 | $4,231 | $319,362 | $250,176 | $69,186 |
| 2015 | $4,168 | $314,566 | $246,419 | $68,147 |
| 2014 | $4,116 | $308,405 | $241,592 | $66,813 |
Source: Public Records
Map
Nearby Homes
- 9208 Canford St
- 7019 Passons Blvd
- 7021 Passons Blvd
- 9213 Call St
- 9512 Nan St
- 9004 Caddy St
- 9632 Abbotsford Rd
- 7558 Citronell Ave
- 9603 Homebrook St
- 6622 Phaeton Ave
- 8826 Bermudez St
- 6733 Candace Ave
- 9430 Mines Ave
- 7840 Pioneer Blvd
- 8216 Chaney Ave
- 9140 Rosehedge Dr
- 9012 Bradhurst St
- 8129 Milna Ave
- 9729 Homestead St
- 7406 Norwalk Blvd
- 9218 Canford St Unit 9218 Canford St
- 9218 Canford St
- 9230 Canford St
- 9229 Danbridge St
- 9212 Canford St
- 9223 Danbridge St
- 9239 Danbridge St
- 9219 Danbridge St
- 9225 Canford St
- 9221 Canford St
- 9231 Canford St
- 9242 Canford St
- 9245 Danbridge St
- 9213 Danbridge St
- 9215 Canford St
- 9237 Canford St
- 9202 Canford St
- 9209 Canford St
- 9251 Danbridge St
- 9207 Danbridge St