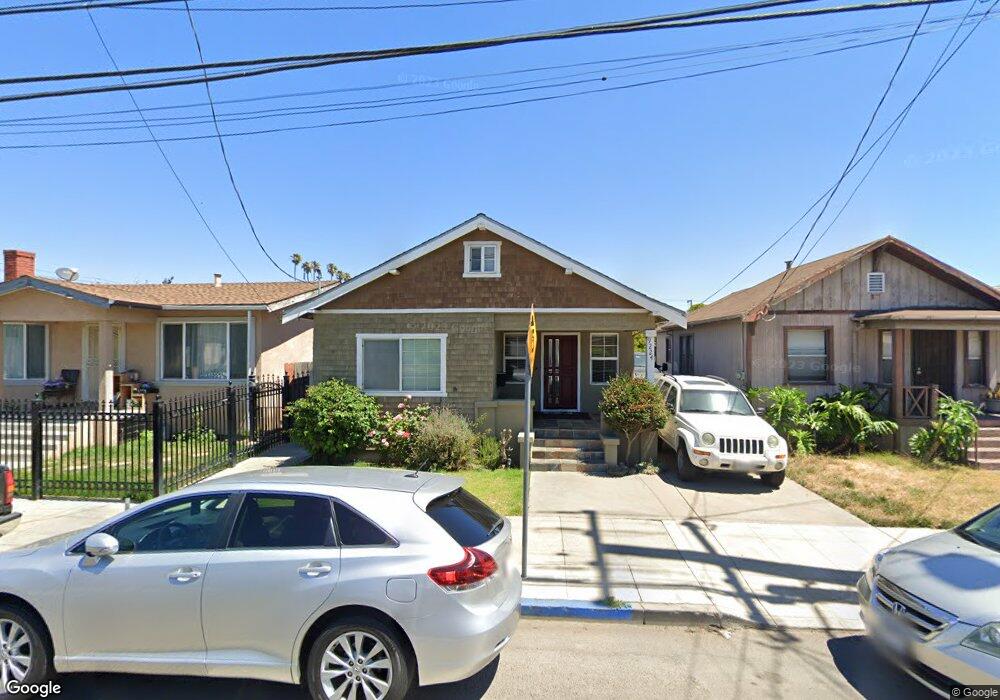
9224 Holly St Oakland, CA 94603
Cox NeighborhoodEstimated Value: $471,000 - $578,000
3
Beds
1
Bath
1,104
Sq Ft
$466/Sq Ft
Est. Value
About This Home
This home is located at 9224 Holly St, Oakland, CA 94603 and is currently estimated at $514,570, approximately $466 per square foot. 9224 Holly St is a home located in Alameda County with nearby schools including Reach Academy, Elmhurst United Middle School, and Coliseum College Prep Academy.
Ownership History
Date
Name
Owned For
Owner Type
Purchase Details
Closed on
Feb 24, 2016
Sold by
Fujita Michael
Bought by
Juarez Nestor Alonso
Current Estimated Value
Purchase Details
Closed on
Jun 30, 2010
Sold by
Juarez Nestor Alonso
Bought by
Fujita Michael
Purchase Details
Closed on
Oct 16, 2002
Sold by
Juarez Alberto and Juarez Maria
Bought by
Juarez Nestor Alonso
Purchase Details
Closed on
Feb 16, 1994
Sold by
Gallo Enrique and Gallo Gaudalupe M
Bought by
Juarez Alberto and Juarez Maria
Home Financials for this Owner
Home Financials are based on the most recent Mortgage that was taken out on this home.
Original Mortgage
$110,673
Interest Rate
6.98%
Mortgage Type
FHA
Create a Home Valuation Report for This Property
The Home Valuation Report is an in-depth analysis detailing your home's value as well as a comparison with similar homes in the area
Home Values in the Area
Average Home Value in this Area
Purchase History
| Date | Buyer | Sale Price | Title Company |
|---|---|---|---|
| Juarez Nestor Alonso | -- | None Available | |
| Fujita Michael | $110,000 | North American Title Co Inc | |
| Juarez Nestor Alonso | -- | -- | |
| Juarez Alberto | $110,000 | Chicago Title Company |
Source: Public Records
Mortgage History
| Date | Status | Borrower | Loan Amount |
|---|---|---|---|
| Previous Owner | Juarez Alberto | $110,673 |
Source: Public Records
Tax History
| Year | Tax Paid | Tax Assessment Tax Assessment Total Assessment is a certain percentage of the fair market value that is determined by local assessors to be the total taxable value of land and additions on the property. | Land | Improvement |
|---|---|---|---|---|
| 2025 | $6,319 | $355,130 | $106,539 | $248,591 |
| 2024 | $6,319 | $348,167 | $104,450 | $243,717 |
| 2023 | $6,558 | $341,342 | $102,402 | $238,940 |
| 2022 | $6,346 | $334,650 | $100,395 | $234,255 |
| 2021 | $5,992 | $328,088 | $98,426 | $229,662 |
| 2020 | $5,924 | $324,725 | $97,417 | $227,308 |
| 2019 | $5,653 | $318,360 | $95,508 | $222,852 |
| 2018 | $5,536 | $312,120 | $93,636 | $218,484 |
| 2017 | $5,307 | $306,000 | $91,800 | $214,200 |
| 2016 | $2,641 | $119,047 | $35,714 | $83,333 |
| 2015 | $2,621 | $117,260 | $35,178 | $82,082 |
| 2014 | $2,498 | $114,962 | $34,488 | $80,474 |
Source: Public Records
Map
Nearby Homes
- 1442 92nd Ave
- 9219 Holly St
- 9251 International Blvd
- 1355 91st Ave
- 9220 Cherry St
- 9337 International Blvd
- 1302 91st Ave
- 9028 A St
- 1840 90th Ave
- 1629 88th Ave
- 1725 96th Ave
- 1262 94th Ave
- 1715 87th Ave
- 9639 International Blvd
- 9725 Holly St
- 1605 Auseon Ave
- 1331 87th Ave
- 1311 87th Ave
- 9419 B St
- 1211 96th Ave
Your Personal Tour Guide
Ask me questions while you tour the home.