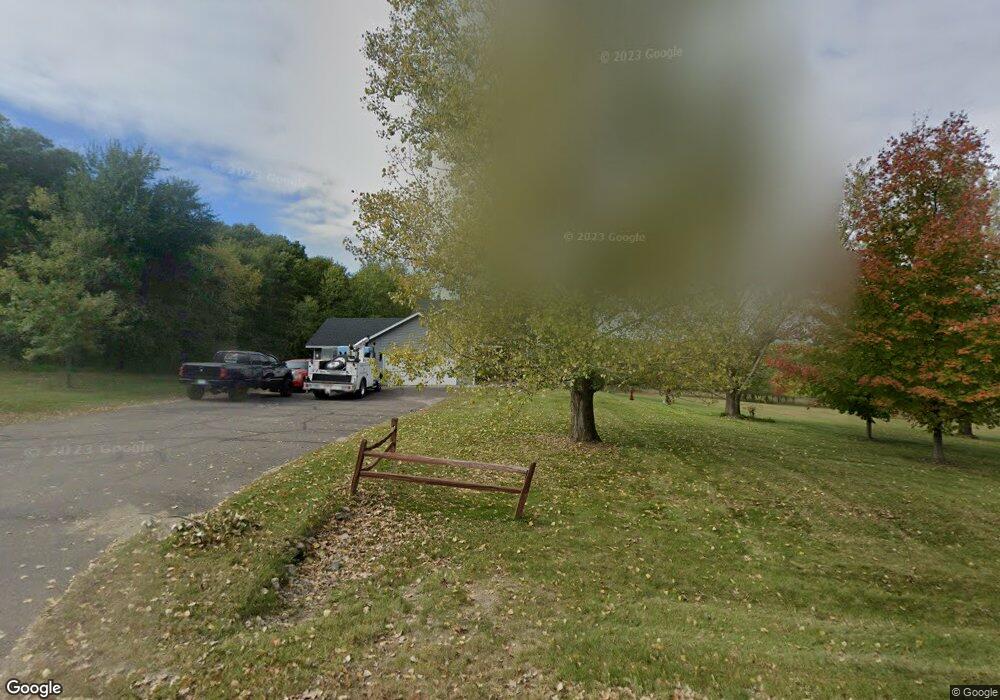
9226 134th Ave SE Becker, MN 55308
Estimated Value: $372,303 - $468,000
2
Beds
2
Baths
1,213
Sq Ft
$330/Sq Ft
Est. Value
About This Home
This home is located at 9226 134th Ave SE, Becker, MN 55308 and is currently estimated at $400,076, approximately $329 per square foot. 9226 134th Ave SE is a home located in Sherburne County with nearby schools including Becker Primary School, Becker Intermediate Elementary School, and Becker Middle School.
Ownership History
Date
Name
Owned For
Owner Type
Purchase Details
Closed on
Aug 23, 2021
Sold by
Lindberg Timothy J and Lindberg Karen
Bought by
Robertson Jacob
Current Estimated Value
Home Financials for this Owner
Home Financials are based on the most recent Mortgage that was taken out on this home.
Original Mortgage
$255,000
Outstanding Balance
$229,626
Interest Rate
2.7%
Mortgage Type
New Conventional
Estimated Equity
$170,450
Purchase Details
Closed on
Jul 25, 2003
Sold by
Pittman Jeremy D and Pittman Melissa A
Bought by
Lindberg Timothyj and Lindberg Karen
Purchase Details
Closed on
Nov 24, 1999
Sold by
Puckett Kenneth M and Puckett Lorie B
Bought by
Pittman Jeremy and Pittman Melissa A
Purchase Details
Closed on
Nov 17, 1999
Sold by
R & N Acquisitions
Bought by
Puckett Kenneth M
Purchase Details
Closed on
Mar 1, 1999
Sold by
Aquisitions R and Aquisitions N
Bought by
Puckett Kenneth M
Create a Home Valuation Report for This Property
The Home Valuation Report is an in-depth analysis detailing your home's value as well as a comparison with similar homes in the area
Home Values in the Area
Average Home Value in this Area
Purchase History
| Date | Buyer | Sale Price | Title Company |
|---|---|---|---|
| Robertson Jacob | $265,000 | Executive Title | |
| Lindberg Timothyj | $209,900 | -- | |
| Pittman Jeremy | $134,500 | -- | |
| Puckett Kenneth M | $27,500 | -- | |
| Puckett Kenneth M | $27,500 | -- | |
| Robertson Jacob Jacob | $265,000 | -- |
Source: Public Records
Mortgage History
| Date | Status | Borrower | Loan Amount |
|---|---|---|---|
| Open | Robertson Jacob | $255,000 | |
| Closed | Puckett Kenneth M | -- | |
| Closed | Robertson Jacob Jacob | $255,000 |
Source: Public Records
Tax History
| Year | Tax Paid | Tax Assessment Tax Assessment Total Assessment is a certain percentage of the fair market value that is determined by local assessors to be the total taxable value of land and additions on the property. | Land | Improvement |
|---|---|---|---|---|
| 2025 | $3,720 | $387,100 | $153,900 | $233,200 |
| 2024 | $3,648 | $376,000 | $145,800 | $230,200 |
| 2023 | $3,432 | $378,400 | $145,800 | $232,600 |
| 2022 | $3,118 | $355,700 | $123,100 | $232,600 |
| 2020 | $2,942 | $276,800 | $73,100 | $203,700 |
| 2019 | $2,686 | $260,000 | $67,900 | $192,100 |
| 2018 | $2,506 | $243,500 | $65,000 | $178,500 |
| 2017 | $2,250 | $224,900 | $59,500 | $165,400 |
| 2016 | $2,264 | $200,100 | $53,200 | $146,900 |
| 2015 | $1,866 | $179,300 | $48,000 | $131,300 |
| 2014 | $1,830 | $161,700 | $39,300 | $122,400 |
| 2013 | -- | $150,000 | $35,900 | $114,100 |
Source: Public Records
Map
Nearby Homes
- 13476 91st St SE
- 9336 131st Ave SE
- 8245 W Beatrice Dr
- 13502 Johnson St
- 13294 Jackson St
- 13306 Ivy St
- 8527 122nd Ave SE
- TBD 148th Ave SE
- 13326 Mallard Dr SE
- 11163 Nikolas Ave
- 13594 Jesse St
- TBD 125th Ave
- 11184 Brenda Blvd
- 11188 Katherine Ave
- L1 B1 Edgewood St SE
- 13905 Woodland Ct
- 12970 Martin Dr
- TBD Lot 18 Block 1 Parkview Dr
- 11252 Prairie Village Ln
- xxx Carole Dr
- 9278 134th Ave SE
- 9278 134th Ave SE
- 9263 134th Ave SE
- 9128 134th Ave SE
- 9231 134th Ave SE
- 9311 134th Ave SE
- 9143 134th Ave SE
- 13265 91st St SE
- 9196 132nd Ave SE
- 13493 91st St SE
- 9358 134th Ave SE
- 13346 94th St SE
- 9343 134th Ave SE
- 13354 91st St SE
- 13613 91st St SE
- 13318 91st St SE
- 13438 91st St SE
- 9162 132nd Ave SE
- 13294 94th St SE
- 13272 91st St SE
Your Personal Tour Guide
Ask me questions while you tour the home.