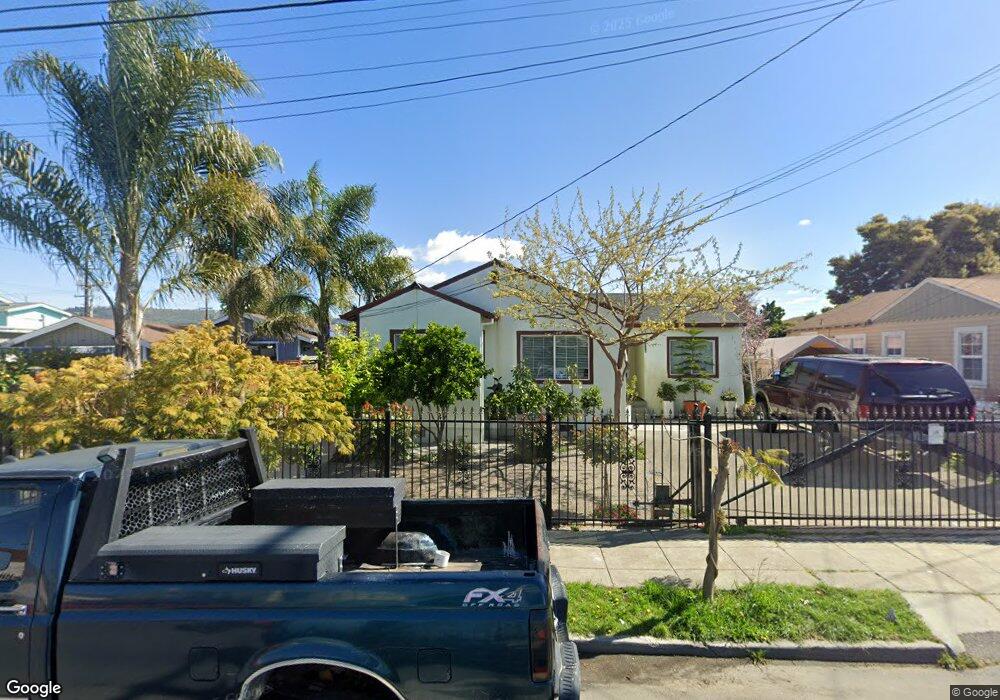
9226 C St Oakland, CA 94603
Elmhurst Park NeighborhoodEstimated Value: $456,000 - $549,000
3
Beds
2
Baths
1,036
Sq Ft
$496/Sq Ft
Est. Value
About This Home
This home is located at 9226 C St, Oakland, CA 94603 and is currently estimated at $513,360, approximately $495 per square foot. 9226 C St is a home located in Alameda County with nearby schools including New Highland Academy, Acorn Woodland Elementary School, and Encompass Academy Elementary.
Ownership History
Date
Name
Owned For
Owner Type
Purchase Details
Closed on
May 27, 2021
Sold by
Vasquez Gilbertina G
Bought by
Vasquez Gilbertina G and Padilla Josue Felix
Current Estimated Value
Home Financials for this Owner
Home Financials are based on the most recent Mortgage that was taken out on this home.
Original Mortgage
$427,099
Outstanding Balance
$386,685
Interest Rate
2.9%
Mortgage Type
New Conventional
Estimated Equity
$126,675
Purchase Details
Closed on
Aug 19, 2019
Sold by
Lin Xian Chong and Zhang Rui Hui
Bought by
Vasquez Gilbertina G
Home Financials for this Owner
Home Financials are based on the most recent Mortgage that was taken out on this home.
Original Mortgage
$427,500
Interest Rate
3.7%
Mortgage Type
New Conventional
Purchase Details
Closed on
Aug 16, 2019
Sold by
Vasquez Josue
Bought by
Vasquez Gilbertina G
Home Financials for this Owner
Home Financials are based on the most recent Mortgage that was taken out on this home.
Original Mortgage
$427,500
Interest Rate
3.7%
Mortgage Type
New Conventional
Purchase Details
Closed on
Jun 8, 2011
Sold by
Chan Kelvin Kui
Bought by
Lin Xian Chong and Zhang Rui Hui
Purchase Details
Closed on
Mar 28, 2011
Sold by
Deleon Marco A and Deleon Cecilia
Bought by
Chan Kelvin Kui
Purchase Details
Closed on
Jan 25, 2005
Sold by
Brown Linda Delores
Bought by
Deleon Marco A and Deleon Cecilia
Home Financials for this Owner
Home Financials are based on the most recent Mortgage that was taken out on this home.
Original Mortgage
$268,000
Interest Rate
5.87%
Mortgage Type
Purchase Money Mortgage
Purchase Details
Closed on
Mar 23, 2004
Sold by
Brown Linda Delores
Bought by
Brown Linda Delores
Home Financials for this Owner
Home Financials are based on the most recent Mortgage that was taken out on this home.
Original Mortgage
$110,000
Interest Rate
5.64%
Mortgage Type
New Conventional
Purchase Details
Closed on
Nov 15, 1993
Sold by
Brown James Leonard
Bought by
Brown Linda Delores
Create a Home Valuation Report for This Property
The Home Valuation Report is an in-depth analysis detailing your home's value as well as a comparison with similar homes in the area
Home Values in the Area
Average Home Value in this Area
Purchase History
| Date | Buyer | Sale Price | Title Company |
|---|---|---|---|
| Vasquez Gilbertina G | -- | Placer Title Company | |
| Vasquez Gilbertina G | $450,000 | Fidelity National Title Co | |
| Vasquez Gilbertina G | -- | Fidelity National Title Co | |
| Lin Xian Chong | $112,000 | Chicago Title Company | |
| Chan Kelvin Kui | -- | Chicago Title Company | |
| Chan Kelvin Kui | $79,000 | None Available | |
| Deleon Marco A | $335,000 | Commonwealth Land Title Co | |
| Brown Linda Delores | -- | Fidelity National Title Co | |
| Brown Linda Delores | -- | -- |
Source: Public Records
Mortgage History
| Date | Status | Borrower | Loan Amount |
|---|---|---|---|
| Open | Vasquez Gilbertina G | $427,099 | |
| Closed | Vasquez Gilbertina G | $427,500 | |
| Previous Owner | Deleon Marco A | $268,000 | |
| Previous Owner | Brown Linda Delores | $110,000 | |
| Closed | Deleon Marco A | $67,000 |
Source: Public Records
Tax History Compared to Growth
Tax History
| Year | Tax Paid | Tax Assessment Tax Assessment Total Assessment is a certain percentage of the fair market value that is determined by local assessors to be the total taxable value of land and additions on the property. | Land | Improvement |
|---|---|---|---|---|
| 2025 | $8,012 | $492,133 | $147,640 | $344,493 |
| 2024 | $8,012 | $482,484 | $144,745 | $337,739 |
| 2023 | $8,365 | $473,025 | $141,907 | $331,118 |
| 2022 | $8,124 | $463,751 | $139,125 | $324,626 |
| 2021 | $7,731 | $454,661 | $136,398 | $318,263 |
| 2020 | $7,645 | $450,000 | $135,000 | $315,000 |
| 2019 | $3,056 | $128,628 | $38,588 | $90,040 |
| 2018 | $2,994 | $126,107 | $37,832 | $88,275 |
| 2017 | $2,847 | $123,634 | $37,090 | $86,544 |
| 2016 | $2,670 | $121,211 | $36,363 | $84,848 |
| 2015 | $2,651 | $119,391 | $35,817 | $83,574 |
| 2014 | $2,528 | $117,053 | $35,116 | $81,937 |
Source: Public Records
Map
Nearby Homes