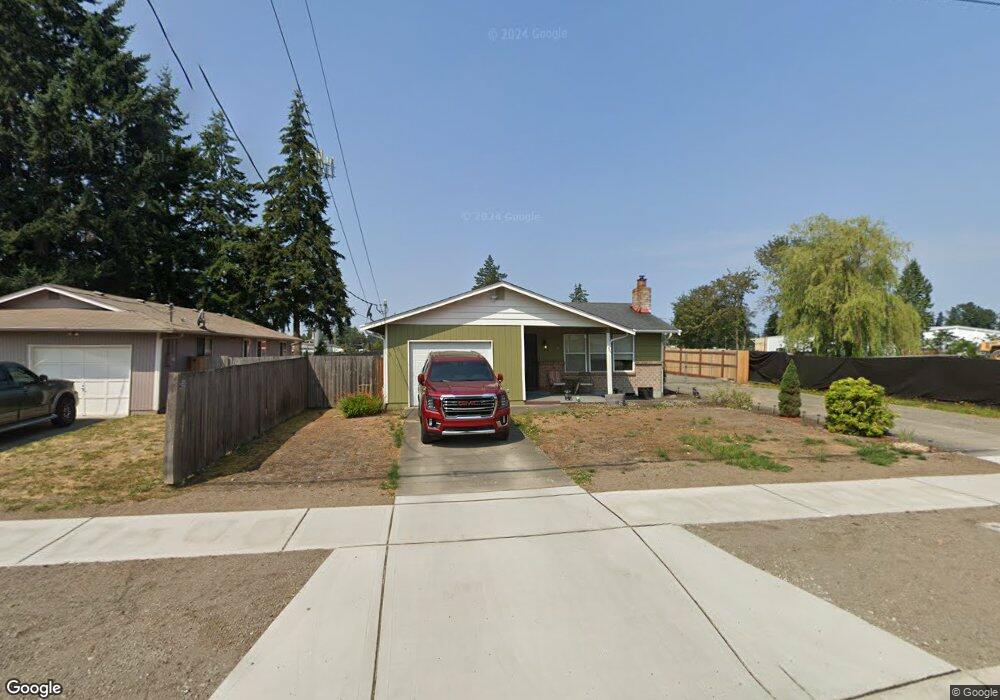
9228 A St Tacoma, WA 98444
South End NeighborhoodEstimated Value: $405,000 - $463,726
3
Beds
2
Baths
1,165
Sq Ft
$373/Sq Ft
Est. Value
About This Home
This home is located at 9228 A St, Tacoma, WA 98444 and is currently estimated at $434,432, approximately $372 per square foot. 9228 A St is a home located in Pierce County with nearby schools including Larchmont Elementary School, Baker Middle School, and Mount Tahoma High School.
Ownership History
Date
Name
Owned For
Owner Type
Purchase Details
Closed on
Jun 8, 2009
Sold by
Butt Margarett D and Butt Kenneth R
Bought by
Greinke Jeff and Greinke Cindy
Current Estimated Value
Home Financials for this Owner
Home Financials are based on the most recent Mortgage that was taken out on this home.
Original Mortgage
$147,283
Outstanding Balance
$93,005
Interest Rate
4.76%
Mortgage Type
FHA
Estimated Equity
$341,427
Purchase Details
Closed on
Sep 22, 2004
Sold by
Butt Edwin R
Bought by
Butt Kenneth R and Butt Margaret D
Home Financials for this Owner
Home Financials are based on the most recent Mortgage that was taken out on this home.
Original Mortgage
$138,400
Interest Rate
8.25%
Mortgage Type
New Conventional
Create a Home Valuation Report for This Property
The Home Valuation Report is an in-depth analysis detailing your home's value as well as a comparison with similar homes in the area
Home Values in the Area
Average Home Value in this Area
Purchase History
| Date | Buyer | Sale Price | Title Company |
|---|---|---|---|
| Greinke Jeff | $150,000 | Fatco | |
| Butt Kenneth R | $173,000 | Pnwt |
Source: Public Records
Mortgage History
| Date | Status | Borrower | Loan Amount |
|---|---|---|---|
| Open | Greinke Jeff | $147,283 | |
| Previous Owner | Butt Kenneth R | $138,400 |
Source: Public Records
Tax History Compared to Growth
Tax History
| Year | Tax Paid | Tax Assessment Tax Assessment Total Assessment is a certain percentage of the fair market value that is determined by local assessors to be the total taxable value of land and additions on the property. | Land | Improvement |
|---|---|---|---|---|
| 2025 | $4,553 | $438,700 | $190,100 | $248,600 |
| 2024 | $4,553 | $442,400 | $192,100 | $250,300 |
| 2023 | $4,553 | $408,900 | $184,200 | $224,700 |
| 2022 | $4,082 | $422,400 | $177,800 | $244,600 |
| 2021 | $3,774 | $300,100 | $116,600 | $183,500 |
| 2019 | $3,243 | $276,500 | $99,800 | $176,700 |
| 2018 | $3,385 | $249,400 | $81,000 | $168,400 |
| 2017 | $2,993 | $214,200 | $62,200 | $152,000 |
| 2016 | $2,649 | $164,100 | $47,000 | $117,100 |
| 2014 | $2,160 | $152,300 | $45,600 | $106,700 |
| 2013 | $2,160 | $132,500 | $38,700 | $93,800 |
Source: Public Records
Map
Nearby Homes