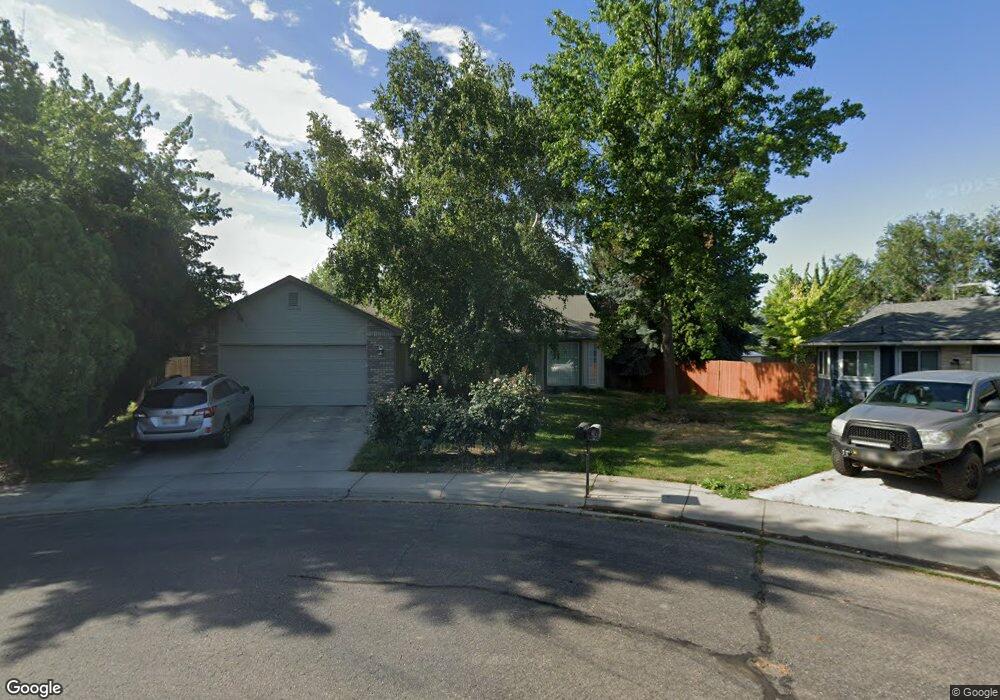
9229 W Rifleman Ct Boise, ID 83704
West Boise NeighborhoodEstimated Value: $414,000 - $452,000
3
Beds
2
Baths
1,403
Sq Ft
$305/Sq Ft
Est. Value
About This Home
This home is located at 9229 W Rifleman Ct, Boise, ID 83704 and is currently estimated at $427,260, approximately $304 per square foot. 9229 W Rifleman Ct is a home located in Ada County with nearby schools including Horizon Elementary School, Fairmont Junior High School, and Capital High School.
Ownership History
Date
Name
Owned For
Owner Type
Purchase Details
Closed on
Sep 14, 2015
Sold by
Hansen Lise Haymond and Hansen Mark
Bought by
Bannon Brian T O and Bannon Mikiko Uchida O
Current Estimated Value
Home Financials for this Owner
Home Financials are based on the most recent Mortgage that was taken out on this home.
Original Mortgage
$155,900
Outstanding Balance
$122,240
Interest Rate
3.86%
Mortgage Type
New Conventional
Estimated Equity
$305,020
Purchase Details
Closed on
May 4, 2015
Sold by
Hansen Lise Haymond
Bought by
Hansen Lise Haymond
Purchase Details
Closed on
Apr 26, 2007
Sold by
Mckinlay M K and Reininger March
Bought by
Haymond Jay M
Purchase Details
Closed on
Dec 8, 2000
Sold by
Armstrong Ronald R and Armstrong Joy L
Bought by
Freiburger Stephen F and Freiburger Rosalie M
Home Financials for this Owner
Home Financials are based on the most recent Mortgage that was taken out on this home.
Original Mortgage
$75,000
Interest Rate
7.66%
Mortgage Type
Purchase Money Mortgage
Create a Home Valuation Report for This Property
The Home Valuation Report is an in-depth analysis detailing your home's value as well as a comparison with similar homes in the area
Home Values in the Area
Average Home Value in this Area
Purchase History
| Date | Buyer | Sale Price | Title Company |
|---|---|---|---|
| Bannon Brian T O | -- | Fidelity National Title Bois | |
| Hansen Lise Haymond | -- | None Available | |
| Haymond Jay M | -- | Stewart Title Company | |
| Freiburger Stephen F | -- | Alliance Title & Escrow Corp |
Source: Public Records
Mortgage History
| Date | Status | Borrower | Loan Amount |
|---|---|---|---|
| Open | Bannon Brian T O | $155,900 | |
| Previous Owner | Freiburger Stephen F | $75,000 |
Source: Public Records
Tax History Compared to Growth
Tax History
| Year | Tax Paid | Tax Assessment Tax Assessment Total Assessment is a certain percentage of the fair market value that is determined by local assessors to be the total taxable value of land and additions on the property. | Land | Improvement |
|---|---|---|---|---|
| 2025 | $2,274 | $376,700 | -- | -- |
| 2024 | $2,077 | $375,500 | -- | -- |
| 2023 | $2,077 | $342,500 | $0 | $0 |
| 2022 | $2,830 | $451,200 | $0 | $0 |
| 2021 | $2,292 | $334,600 | $0 | $0 |
| 2020 | $1,940 | $263,300 | $0 | $0 |
| 2019 | $2,023 | $249,000 | $0 | $0 |
| 2018 | $1,586 | $204,400 | $0 | $0 |
| 2017 | $1,436 | $179,600 | $0 | $0 |
| 2016 | $1,338 | $163,400 | $0 | $0 |
| 2015 | $602 | $147,600 | $0 | $0 |
| 2012 | -- | $110,300 | $0 | $0 |
Source: Public Records
Map
Nearby Homes
- 9343 W Olivia St
- 934 N Iris Place
- 1011 N Kimball St
- 9337 W Susan St
- 1003 N Kimball St
- 999 N Kimball St
- 1182 N Iris Ave
- 1098 N Carmen Ave
- 1011 N Fawn Ln
- 1067 N Elk Ln
- 8647 W Antelope Ln
- 8584 W Rifleman St
- 1328 N Arrow Ln
- 944 N Benjamin Ln
- 1238 N Sable Ln
- 8453 W Cascade Ln
- 10070 W Mesquite Ln
- 8405 W Rifleman St
- 1420 N Oakwood Ln
- 112 Quail Run Place
- 9251 W Rifleman Ct
- 9211 W Rifleman Ct
- 9210 W Rifleman Ct
- 9285 W Rifleman Ct
- 9301 W Rifleman Ct
- 9218 W Rifleman Ct
- 9230 W Rifleman Ct
- 9252 W Rifleman Ct
- 9313 W Rifleman Ct
- 9274 W Rifleman Ct
- 9286 W Rifleman Ct
- 9312 W Rifleman Ct
- 9347 W Rifleman Ct
- 9259 W Olivia St
- 9271 W Olivia St
- 9257 W Olivia St
- 9273 W Olivia St
- 9297 W Olivia St
- 9326 W Rifleman Ct
- 9235 W Olivia St