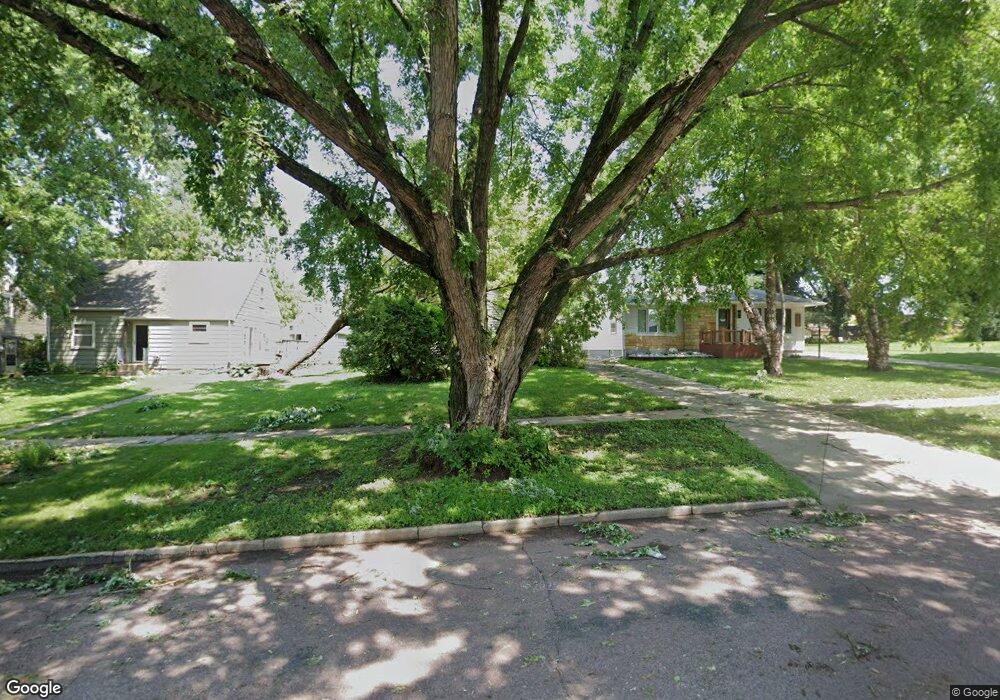
923 11th St Sheldon, IA 51201
Estimated Value: $107,000 - $127,000
2
Beds
3
Baths
957
Sq Ft
$122/Sq Ft
Est. Value
About This Home
This home is located at 923 11th St, Sheldon, IA 51201 and is currently estimated at $116,737, approximately $121 per square foot. 923 11th St is a home located in O'Brien County with nearby schools including East Elementary School, Sheldon Middle School, and Sheldon High School.
Ownership History
Date
Name
Owned For
Owner Type
Purchase Details
Closed on
Dec 3, 2024
Sold by
Verrips James D and Verrips Patricia
Bought by
Schilling Clinton D and Schilling Maleri J
Current Estimated Value
Home Financials for this Owner
Home Financials are based on the most recent Mortgage that was taken out on this home.
Original Mortgage
$64,203
Outstanding Balance
$63,673
Interest Rate
6.54%
Mortgage Type
Credit Line Revolving
Estimated Equity
$53,064
Purchase Details
Closed on
Jan 11, 2021
Sold by
Verrips James D and Verrips Patricia
Bought by
Verrips James D and Verrips Patricia
Create a Home Valuation Report for This Property
The Home Valuation Report is an in-depth analysis detailing your home's value as well as a comparison with similar homes in the area
Home Values in the Area
Average Home Value in this Area
Purchase History
| Date | Buyer | Sale Price | Title Company |
|---|---|---|---|
| Schilling Clinton D | $55,000 | None Listed On Document | |
| Verrips James D | -- | None Available |
Source: Public Records
Mortgage History
| Date | Status | Borrower | Loan Amount |
|---|---|---|---|
| Open | Schilling Clinton D | $64,203 |
Source: Public Records
Tax History
| Year | Tax Paid | Tax Assessment Tax Assessment Total Assessment is a certain percentage of the fair market value that is determined by local assessors to be the total taxable value of land and additions on the property. | Land | Improvement |
|---|---|---|---|---|
| 2025 | $1,346 | $98,300 | $17,060 | $81,240 |
| 2024 | $1,346 | $91,940 | $15,230 | $76,710 |
| 2023 | $1,314 | $91,940 | $15,230 | $76,710 |
| 2022 | $1,286 | $81,830 | $13,130 | $68,700 |
| 2021 | $1,286 | $81,830 | $13,130 | $68,700 |
| 2020 | $1,110 | $69,760 | $7,350 | $62,410 |
| 2019 | $1,106 | $67,730 | $0 | $0 |
| 2018 | $1,032 | $67,730 | $0 | $0 |
| 2017 | $1,132 | $66,610 | $0 | $0 |
| 2016 | $1,138 | $66,610 | $0 | $0 |
| 2015 | $1,138 | $60,680 | $0 | $0 |
| 2014 | $1,028 | $60,680 | $0 | $0 |
Source: Public Records
Map
Nearby Homes
Your Personal Tour Guide
Ask me questions while you tour the home.