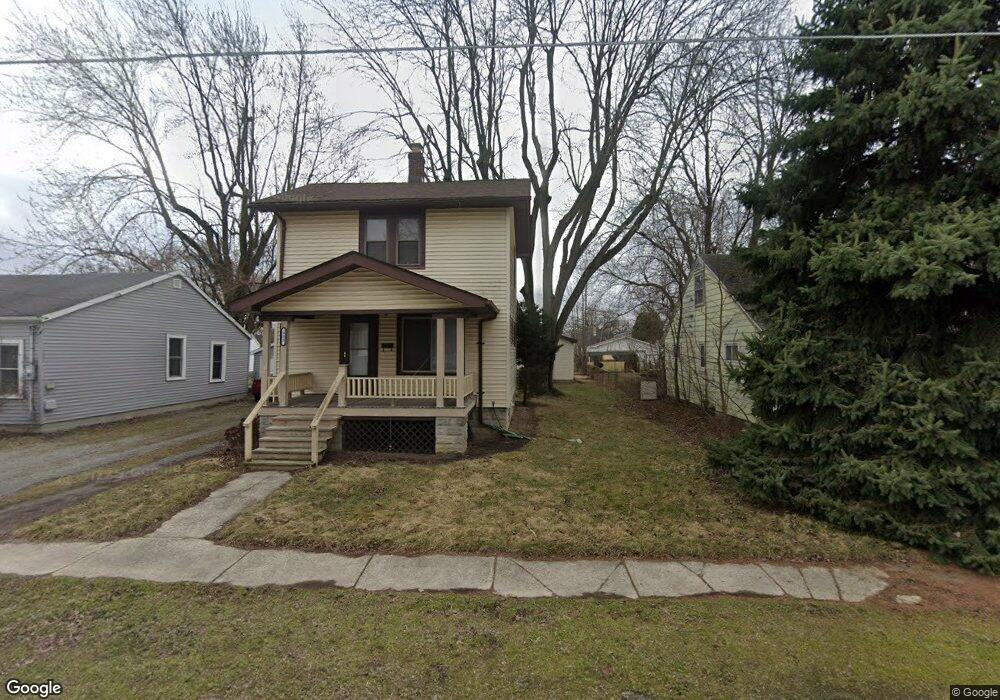
923 Adams St Findlay, OH 45840
Estimated Value: $112,000 - $115,441
--
Bed
1
Bath
920
Sq Ft
$124/Sq Ft
Est. Value
About This Home
This home is located at 923 Adams St, Findlay, OH 45840 and is currently estimated at $114,110, approximately $124 per square foot. 923 Adams St is a home located in Hancock County with nearby schools including Lincoln Elementary School, Donnell Middle School, and Findlay High School.
Ownership History
Date
Name
Owned For
Owner Type
Purchase Details
Closed on
Nov 19, 2001
Sold by
Smith David K
Bought by
Doty Chris A
Current Estimated Value
Home Financials for this Owner
Home Financials are based on the most recent Mortgage that was taken out on this home.
Original Mortgage
$80,900
Outstanding Balance
$31,550
Interest Rate
6.69%
Mortgage Type
New Conventional
Estimated Equity
$82,560
Purchase Details
Closed on
Oct 1, 1999
Sold by
Phillips William
Bought by
Smith David and Smith Martha
Home Financials for this Owner
Home Financials are based on the most recent Mortgage that was taken out on this home.
Original Mortgage
$86,567
Interest Rate
7.93%
Mortgage Type
New Conventional
Purchase Details
Closed on
Apr 22, 1999
Sold by
Est Bradley Hicks
Bought by
Phillips William and Myers Sharon
Purchase Details
Closed on
Nov 29, 1985
Bought by
Hicks Bradley W
Create a Home Valuation Report for This Property
The Home Valuation Report is an in-depth analysis detailing your home's value as well as a comparison with similar homes in the area
Home Values in the Area
Average Home Value in this Area
Purchase History
| Date | Buyer | Sale Price | Title Company |
|---|---|---|---|
| Doty Chris A | $83,500 | -- | |
| Smith David | $70,000 | -- | |
| Phillips William | $55,500 | -- | |
| Hicks Bradley W | $25,500 | -- |
Source: Public Records
Mortgage History
| Date | Status | Borrower | Loan Amount |
|---|---|---|---|
| Open | Doty Chris A | $80,900 | |
| Previous Owner | Smith David | $86,567 |
Source: Public Records
Tax History Compared to Growth
Tax History
| Year | Tax Paid | Tax Assessment Tax Assessment Total Assessment is a certain percentage of the fair market value that is determined by local assessors to be the total taxable value of land and additions on the property. | Land | Improvement |
|---|---|---|---|---|
| 2024 | $1,068 | $30,070 | $5,180 | $24,890 |
| 2023 | $1,070 | $30,070 | $5,180 | $24,890 |
| 2022 | $1,066 | $30,070 | $5,180 | $24,890 |
| 2021 | $1,407 | $34,560 | $5,170 | $29,390 |
| 2020 | $1,407 | $34,560 | $5,170 | $29,390 |
| 2019 | $1,378 | $34,560 | $5,170 | $29,390 |
| 2018 | $1,253 | $28,820 | $4,240 | $24,580 |
| 2017 | $627 | $28,820 | $4,240 | $24,580 |
| 2016 | $1,243 | $28,820 | $4,240 | $24,580 |
| 2015 | $891 | $20,380 | $4,240 | $16,140 |
| 2014 | $892 | $20,380 | $4,240 | $16,140 |
| 2012 | $827 | $18,750 | $4,240 | $14,510 |
Source: Public Records
Map
Nearby Homes
- 514 Liberty St
- 407 Washington St
- 419 W Lincoln St
- 720 S West St
- 416 1/2 Lima Ave
- 412 Lima Ave
- 535 Palm Dr
- 225 Lima Ave
- 425 Nevada Ln
- 0 Canadian Way Unit 20253551
- 0 Canadian Way Unit 6135400
- 512 N Cory St
- 224 Defiance Ave
- 1115 Liberty St
- 0 Waterford Way Lot 78 Unit 6089639
- 1005 Broad Ave
- 706 N Cory St
- 213 Cherry St
- 2014 W Sandusky St
- 829 Maple Ave