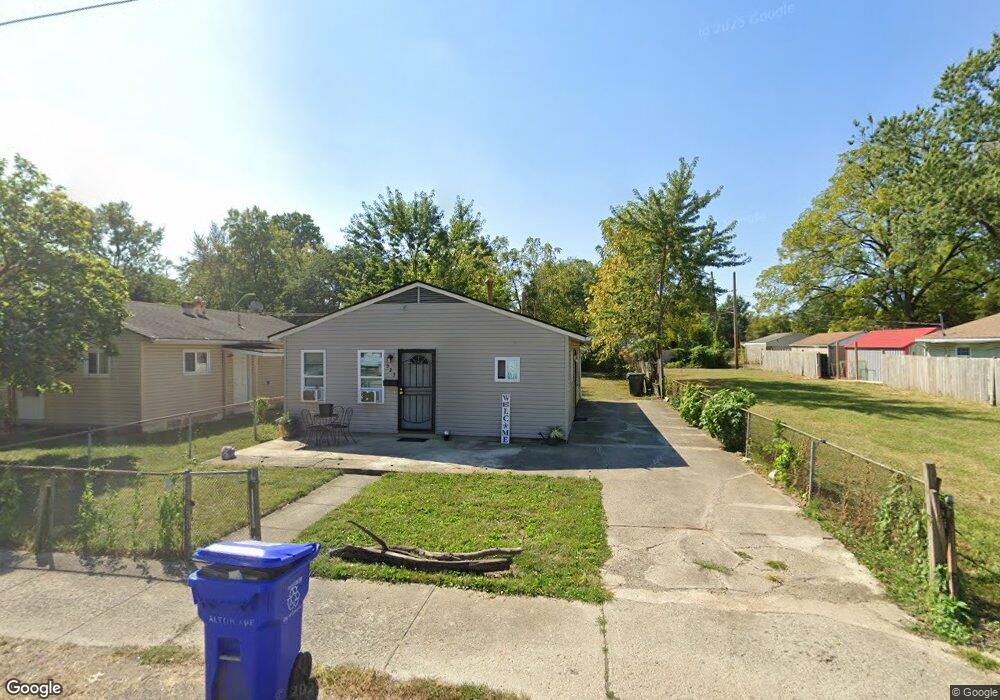
923 Alton Ave Columbus, OH 43219
Estimated Value: $102,000 - $143,000
3
Beds
1
Bath
864
Sq Ft
$148/Sq Ft
Est. Value
About This Home
This home is located at 923 Alton Ave, Columbus, OH 43219 and is currently estimated at $127,526, approximately $147 per square foot. 923 Alton Ave is a home located in Franklin County with nearby schools including East Columbus Elementary School, Champion Middle School, and East High School.
Ownership History
Date
Name
Owned For
Owner Type
Purchase Details
Closed on
Nov 5, 2021
Sold by
Franklin County Treasurer
Bought by
Five14 Holdings Llc
Current Estimated Value
Purchase Details
Closed on
Jan 17, 2019
Sold by
City Of Colmbus
Bought by
Five14 Holdings Llc
Purchase Details
Closed on
Mar 26, 2018
Sold by
Central Ohio Community Improvement Cor
Bought by
City Of Columbus
Purchase Details
Closed on
Feb 6, 2018
Sold by
Mingo Clarence E
Bought by
Central Ohio Community Improvement Corpo
Purchase Details
Closed on
Mar 26, 2004
Sold by
Jackson Cecil C and Jackson Euzera
Bought by
Lalla Glen D
Purchase Details
Closed on
Mar 3, 1971
Bought by
Jackson Cecil C
Create a Home Valuation Report for This Property
The Home Valuation Report is an in-depth analysis detailing your home's value as well as a comparison with similar homes in the area
Home Values in the Area
Average Home Value in this Area
Purchase History
| Date | Buyer | Sale Price | Title Company |
|---|---|---|---|
| Five14 Holdings Llc | -- | -- | |
| Five14 Holdings Llc | -- | None Available | |
| City Of Columbus | -- | None Available | |
| Central Ohio Community Improvement Corpo | -- | None Available | |
| Lalla Glen D | $58,500 | -- | |
| Jackson Cecil C | -- | -- |
Source: Public Records
Tax History Compared to Growth
Tax History
| Year | Tax Paid | Tax Assessment Tax Assessment Total Assessment is a certain percentage of the fair market value that is determined by local assessors to be the total taxable value of land and additions on the property. | Land | Improvement |
|---|---|---|---|---|
| 2024 | $2,392 | $34,930 | $9,380 | $25,550 |
| 2023 | $1,581 | $34,930 | $9,380 | $25,550 |
| 2022 | $950 | $11,520 | $1,680 | $9,840 |
| 2021 | $855 | $11,520 | $1,680 | $9,840 |
| 2020 | $840 | $11,520 | $1,680 | $9,840 |
| 2019 | $120 | $8,610 | $1,540 | $7,070 |
| 2018 | $399 | $8,610 | $1,540 | $7,070 |
| 2017 | $669 | $8,610 | $1,540 | $7,070 |
| 2016 | $1,461 | $11,830 | $2,240 | $9,590 |
| 2015 | $732 | $11,830 | $2,240 | $9,590 |
| 2014 | $734 | $11,830 | $2,240 | $9,590 |
| 2013 | $425 | $13,895 | $2,625 | $11,270 |
Source: Public Records
Map
Nearby Homes
- 2857 E 10th Ave
- 2969 E 11th Ave
- 2812 E 11th Ave
- 2814 E 9th Ave
- 799 Alton Ave
- 2718 Roxbury Rd
- 2872 E 6th Ave
- 0 E 7th Ave Unit Lot 79 225013171
- 0 E 7th Ave Unit Lot 77 225013170
- 0 E 7th Ave Unit Lot 78 225013168
- 00 E 7th Ave
- 3059 E 8th Ave
- 2822-2824 E 5th Ave
- 3018 E 6th Ave Unit 20
- 2742 E 5th Ave
- 796 Northview Ave
- 782 Northview Ave
- 691-693 N Dawson Ave
- 3116 E 5th Ave
- 3121 E 5th Ave