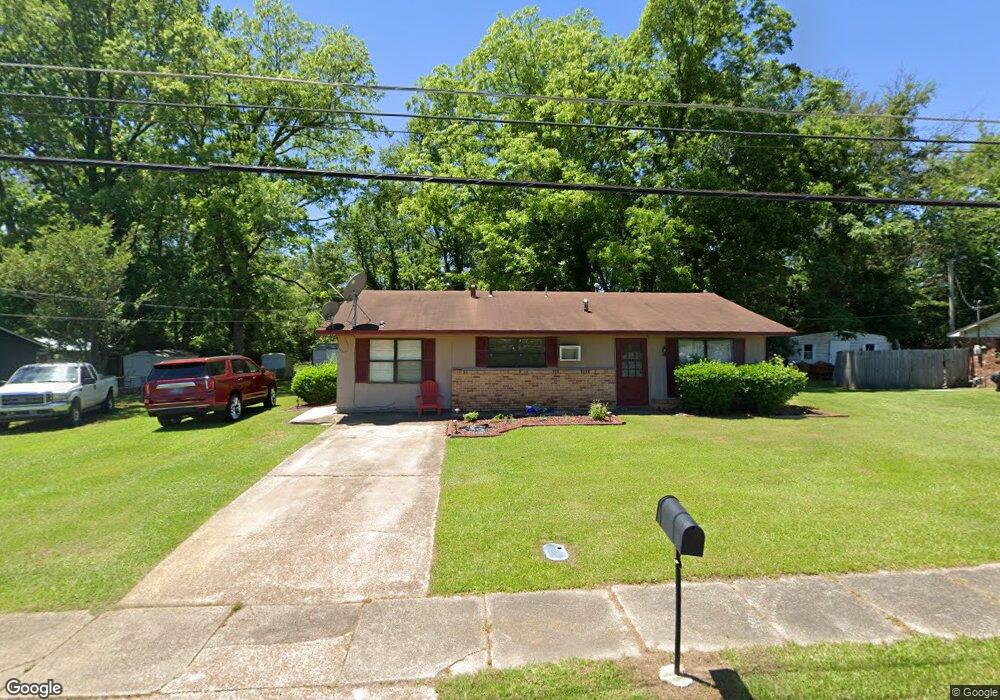
923 Cromwell St West Point, MS 39773
Estimated Value: $82,000 - $93,000
3
Beds
--
Bath
991
Sq Ft
$86/Sq Ft
Est. Value
About This Home
This home is located at 923 Cromwell St, West Point, MS 39773 and is currently estimated at $85,289, approximately $86 per square foot. 923 Cromwell St is a home located in Clay County with nearby schools including East Side Elementary School, West Clay Elementary School, and Church Hill Elementary School.
Ownership History
Date
Name
Owned For
Owner Type
Purchase Details
Closed on
Dec 27, 2024
Sold by
House Floyd
Bought by
Dismukes Darrell
Current Estimated Value
Purchase Details
Closed on
Apr 1, 2023
Sold by
Robertson Lyndon Ray
Bought by
Robertson Kemuel L
Purchase Details
Closed on
May 3, 2022
Sold by
Ray Robertson Lyndon
Bought by
Robertson Lyndon Ray and Robertson Kemuel L
Purchase Details
Closed on
Mar 26, 2022
Sold by
Robertson Lyndon Ray
Bought by
Robertson Lyndon Ray and Robertson Gregory
Create a Home Valuation Report for This Property
The Home Valuation Report is an in-depth analysis detailing your home's value as well as a comparison with similar homes in the area
Home Values in the Area
Average Home Value in this Area
Purchase History
| Date | Buyer | Sale Price | Title Company |
|---|---|---|---|
| Dismukes Darrell | -- | None Listed On Document | |
| Robertson Kemuel L | -- | None Listed On Document | |
| Robertson Lyndon Ray | -- | None Listed On Document | |
| Robertson Lyndon Ray | -- | -- |
Source: Public Records
Tax History Compared to Growth
Tax History
| Year | Tax Paid | Tax Assessment Tax Assessment Total Assessment is a certain percentage of the fair market value that is determined by local assessors to be the total taxable value of land and additions on the property. | Land | Improvement |
|---|---|---|---|---|
| 2024 | $347 | $6,392 | $1,242 | $5,150 |
| 2023 | $816 | $5,453 | $1,242 | $4,211 |
| 2022 | $299 | $5,453 | $1,242 | $4,211 |
| 2021 | $298 | $5,453 | $1,242 | $4,211 |
| 2020 | $300 | $5,453 | $1,242 | $4,211 |
| 2019 | $278 | $5,415 | $1,242 | $4,173 |
| 2018 | $0 | $3,610 | $828 | $2,782 |
| 2017 | $0 | $3,610 | $828 | $2,782 |
| 2016 | -- | $3,610 | $828 | $2,782 |
| 2015 | -- | $3,362 | $828 | $2,534 |
| 2014 | -- | $3,362 | $828 | $2,534 |
| 2013 | -- | $3,362 | $828 | $2,534 |
Source: Public Records
Map
Nearby Homes
- 346 E Brame Ave
- 402 Cromwell St
- 238 Calhoun St
- 206 S Division St
- 228 S Division St
- 98 Court St
- 229 S Division St
- 184 Tournament St
- 1046 E Brame Ave
- 15 David St
- 480 E Westbrook St
- 479 E Westbrook St
- 159 Washington St
- 485 E Westbrook St
- 551 E Westbrook St
- 1104 E Broad St
- 1180 E Broad St
- 1153 E Broad St
- 472 S Eshman Ave
- 26788 E Main St
- 917 Cromwell St
- 927 Cromwell St
- 915 Cromwell St
- 905 Cromwell St
- 349 Tom Bayne St
- 328 Tom Bayne St
- 331 Tom Bayne St
- 327 Tom Bayne St
- 343 Tom Bayne St
- 337 Tom Bayne St
- 1002 Grove St
- 92 Tom Bayne St
- 324 Tom Bayne St
- 914 Grove St
- 154 Grove St
- 910 Grove St
- 320 Tom Bayne St
- 906 Grove St
- 902 Grove St
- 1014 Grove St