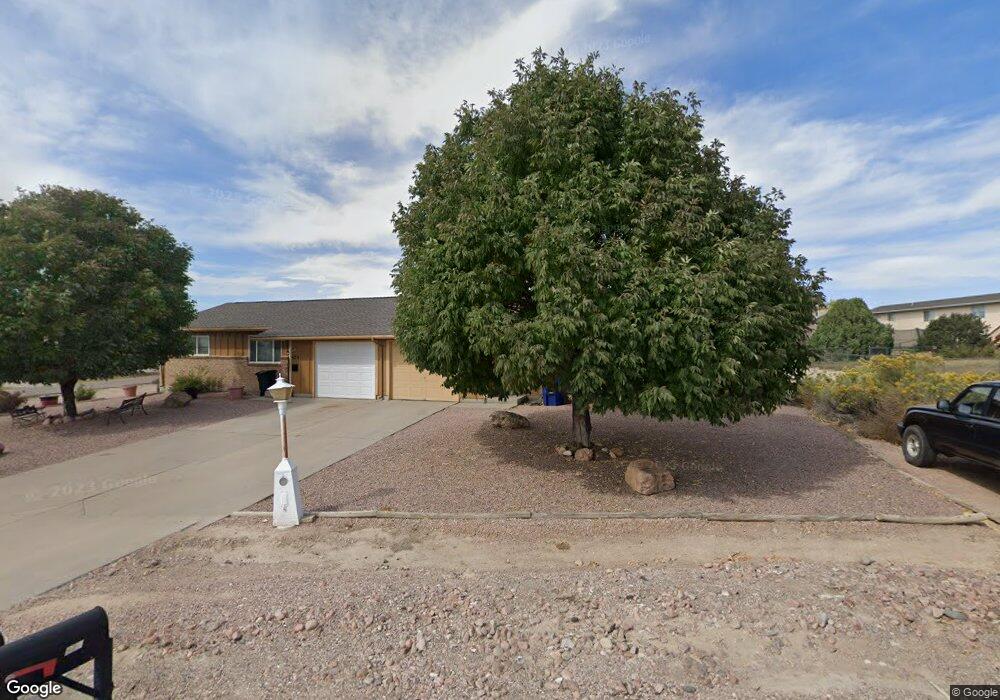
923 S Harmony Dr Pueblo, CO 81007
Estimated Value: $320,026 - $401,000
2
Beds
1
Bath
877
Sq Ft
$415/Sq Ft
Est. Value
About This Home
This home is located at 923 S Harmony Dr, Pueblo, CO 81007 and is currently estimated at $364,009, approximately $415 per square foot. 923 S Harmony Dr is a home located in Pueblo County with nearby schools including Desert Sage Elementary School, Sky View Middle School, and Pueblo West High School.
Ownership History
Date
Name
Owned For
Owner Type
Purchase Details
Closed on
Feb 22, 2017
Sold by
Saunders Dan P and Saunders Joyce A
Bought by
Saunders Danny P and Saunders Joyce A
Current Estimated Value
Home Financials for this Owner
Home Financials are based on the most recent Mortgage that was taken out on this home.
Original Mortgage
$92,200
Outstanding Balance
$45,177
Interest Rate
3.37%
Mortgage Type
New Conventional
Estimated Equity
$318,832
Purchase Details
Closed on
Dec 23, 2002
Sold by
Sullivan and Saunders
Bought by
Saunders D P + J A
Purchase Details
Closed on
Nov 25, 2002
Sold by
Sullivan Warren W + Lorraine
Bought by
Sullivan and Saunders
Purchase Details
Closed on
May 30, 1979
Sold by
Koeller Dorothy A
Bought by
Sullivan Warren W + Lorraine
Purchase Details
Closed on
Dec 19, 1978
Bought by
Koeller Dorothy A
Purchase Details
Closed on
Nov 24, 1978
Sold by
Pfutzenreuter Eleanore R
Purchase Details
Closed on
Mar 6, 1975
Sold by
Weant Glynn B
Bought by
Pfutzenreuter Eleanore R
Create a Home Valuation Report for This Property
The Home Valuation Report is an in-depth analysis detailing your home's value as well as a comparison with similar homes in the area
Home Values in the Area
Average Home Value in this Area
Purchase History
| Date | Buyer | Sale Price | Title Company |
|---|---|---|---|
| Saunders Danny P | -- | Ct | |
| Saunders D P + J A | -- | -- | |
| Sullivan | -- | -- | |
| Sullivan Warren W + Lorraine | $45,900 | -- | |
| Koeller Dorothy A | -- | -- | |
| -- | -- | -- | |
| Pfutzenreuter Eleanore R | -- | -- | |
| Weant Glynn B | -- | -- |
Source: Public Records
Mortgage History
| Date | Status | Borrower | Loan Amount |
|---|---|---|---|
| Open | Saunders Danny P | $92,200 |
Source: Public Records
Tax History Compared to Growth
Tax History
| Year | Tax Paid | Tax Assessment Tax Assessment Total Assessment is a certain percentage of the fair market value that is determined by local assessors to be the total taxable value of land and additions on the property. | Land | Improvement |
|---|---|---|---|---|
| 2024 | $1,276 | $12,690 | -- | -- |
| 2023 | $1,290 | $16,380 | $3,120 | $13,260 |
| 2022 | $1,214 | $12,092 | $2,010 | $10,082 |
| 2021 | $1,271 | $12,710 | $2,110 | $10,600 |
| 2020 | $1,003 | $12,710 | $2,110 | $10,600 |
| 2019 | $1,000 | $10,011 | $358 | $9,653 |
| 2018 | $864 | $8,640 | $324 | $8,316 |
| 2017 | $853 | $8,640 | $324 | $8,316 |
| 2016 | $841 | $8,415 | $517 | $7,898 |
| 2015 | $834 | $8,415 | $517 | $7,898 |
| 2014 | $769 | $7,755 | $597 | $7,158 |
Source: Public Records
Map
Nearby Homes
- 896 S Harmony Dr
- 880 S Concho Place
- 871 S Harmony Dr Unit 873
- 941 S Harmony Dr
- 873 S Harmony Dr
- 866 S Harmony Dr
- 977 S Harmony Dr Unit 979
- 977 S Harmony Dr Unit 977 & 979
- 780 S Honeydew Dr
- 784 S Honeydew Dr
- 351 W Hazelnut Way Unit 353
- 264 W Laurue Ln
- 263 W Laurue Ln
- 919 S Elgin Ct
- 349 W Buttercup Way
- 265 W Delray Dr
- 808 S Palomar Dr
- 959 S Honeysuckle Dr Unit 961
- 705 S Knox Dr Unit 707
- 213 W Palomar Plaza
- 925 S Harmony Dr Unit 927
- 918 S Harmony Place Unit 19
- 306 W Marble Dr Unit 308
- 920 S Harmony Dr
- 920 S Harmony Dr Unit 27
- 914 S Harmony Place
- 924 S Harmony Dr
- 924 S Harmony Dr Unit 26
- 312 W Marble Dr Unit 15
- 928 S Harmony Dr Unit 25
- 928 S Harmony Dr
- 916 S Harmony Dr
- 916 S Harmony Dr Unit 28
- 919 S Harmony Dr Unit 921
- 316 W Marble Dr Unit 318
- 0 W Marble Dr
- 933 S Harmony Dr Unit 935
- 305 W Marble Dr Unit 305-307
- 919 S Harmony Place
- 932 S Harmony Dr Unit 24