
Seller's Agent in 2025
Danny Nguyen, CCIM
Danny Nguyen Commercial
(512) 720-0223
4 Total Sales
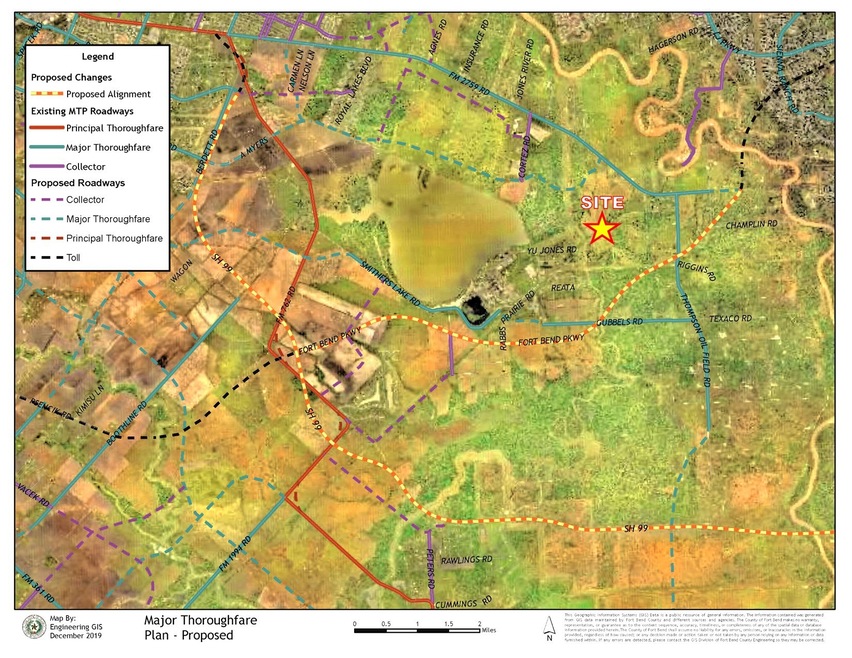


Per Seller: Total of +/-31 AC
OWNER WILLING TO SUBDIVIDE INTO TWO SMALLER TRACTS OF 15.50 +/- ACRES EACH
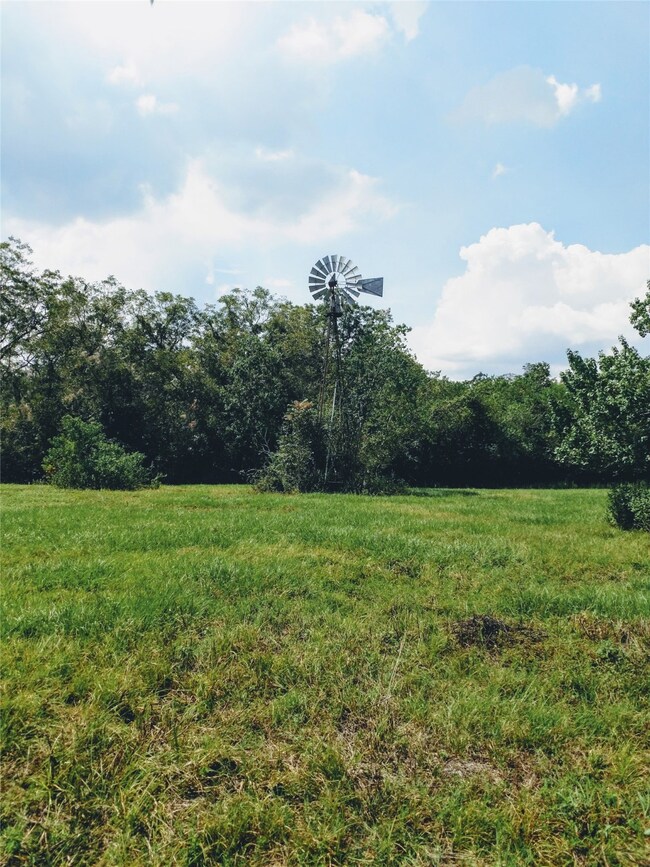
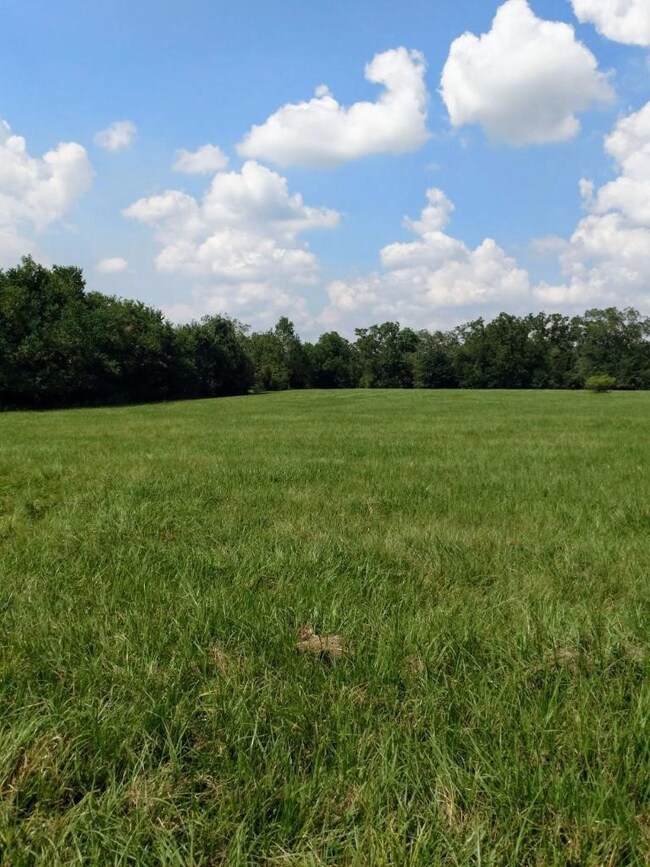
30 +/- acre pasture which is being leased for cattle grazing for the AG Exemption.
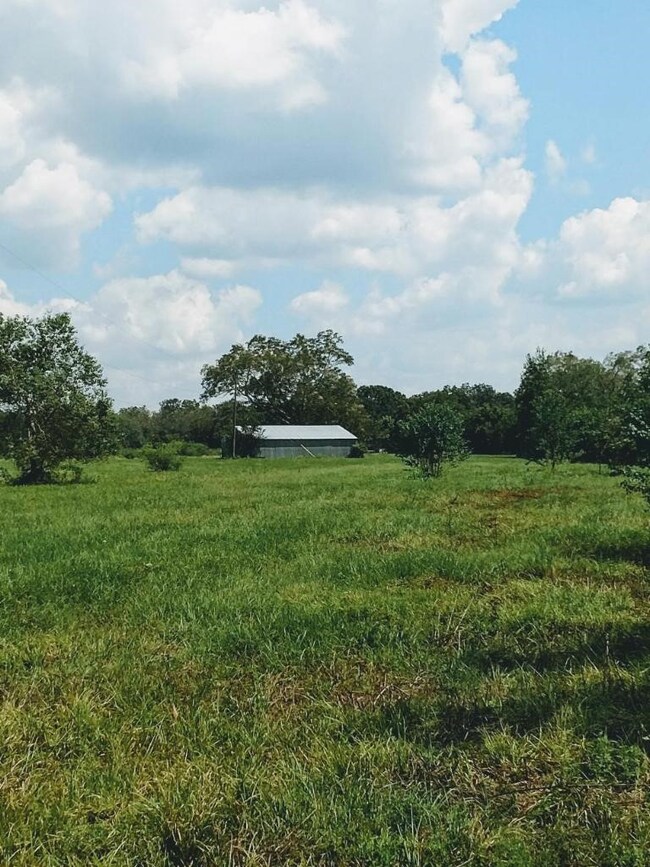
A 1,400 SF hay barn with stalls.
Electric power to the pasture which also has an Electric fence.
Great deer hunting.
192 foot paved frontage on Jerry Rd.
Last Agent to Sell the Property
Danny Nguyen Commercial License #0456765 Listed on: 03/23/2022
Last Buyer's Agent
Danny Nguyen Commercial License #0456765 Listed on: 03/23/2022
Property Type
Est. Annual Taxes
Schools
Additional Features
Community Details
| Date | Status | Loan Amount | Loan Type |
|---|---|---|---|
| Closed | $100,000 | Unknown |
| Date | Event | Price | Change | Sq Ft Price |
|---|---|---|---|---|
| 06/19/2025 06/19/25 | For Sale | $2,500,000 | +177.8% | $504 / Sq Ft |
| 08/08/2024 08/08/24 | Sold | -- | -- | -- |
| 07/02/2024 07/02/24 | Pending | -- | -- | -- |
| 01/02/2024 01/02/24 | For Sale | $900,000 | 0.0% | $152 / Sq Ft |
| 12/31/2023 12/31/23 | Off Market | -- | -- | -- |
| 06/07/2023 06/07/23 | Price Changed | $900,000 | +5.9% | $152 / Sq Ft |
| 04/25/2023 04/25/23 | For Sale | $850,000 | 0.0% | $144 / Sq Ft |
| 03/27/2023 03/27/23 | Pending | -- | -- | -- |
| 03/26/2023 03/26/23 | For Sale | $850,000 | 0.0% | $144 / Sq Ft |
| 03/24/2023 03/24/23 | Off Market | -- | -- | -- |
| 03/24/2022 03/24/22 | Price Changed | $850,000 | +6.3% | $144 / Sq Ft |
| 03/23/2022 03/23/22 | For Sale | $800,000 | -- | $135 / Sq Ft |
| Year | Tax Paid | Tax Assessment Tax Assessment Total Assessment is a certain percentage of the fair market value that is determined by local assessors to be the total taxable value of land and additions on the property. | Land | Improvement |
|---|---|---|---|---|
| 2023 | $4,818 | $621,885 | $0 | $739,758 |
| 2022 | $7,990 | $565,350 | $0 | $669,110 |
| 2021 | $8,710 | $513,950 | $8,700 | $505,250 |
| 2020 | $8,909 | $517,270 | $8,700 | $508,570 |
| 2019 | $9,630 | $519,410 | $8,700 | $510,710 |
| 2018 | $9,206 | $495,180 | $8,700 | $486,480 |
| 2017 | $8,912 | $478,110 | $8,700 | $469,410 |
| 2016 | $10,098 | $541,710 | $71,340 | $470,370 |
| 2015 | $9,170 | $570,150 | $71,340 | $498,810 |
| 2014 | $1,960 | $156,940 | $71,340 | $85,600 |
Seller's Agent in 2025
Danny Nguyen, CCIM
Danny Nguyen Commercial
(512) 720-0223
4 Total Sales
Source: Houston Association of REALTORS®
MLS Number: 79047653
APN: 0018-00-000-0150-901
Disclaimer: Certain information contained herein is derived from information provided by parties other than Homes.com. All information provided is deemed reliable, but is not guaranteed to be accurate and should be independently verified.
![]() Copyright 2025, Houston REALTORS® Information Service, Inc.
Copyright 2025, Houston REALTORS® Information Service, Inc.
The information provided is exclusively for consumers’ personal, non-commercial use, and may not be used for any purpose other than to identify prospective properties consumers may be interested in purchasing.
Information is deemed reliable but not guaranteed.