M
Seller's Agent in 2018
Mandy Neat
Realty One Group

Estimated Value: $342,710 - $377,000
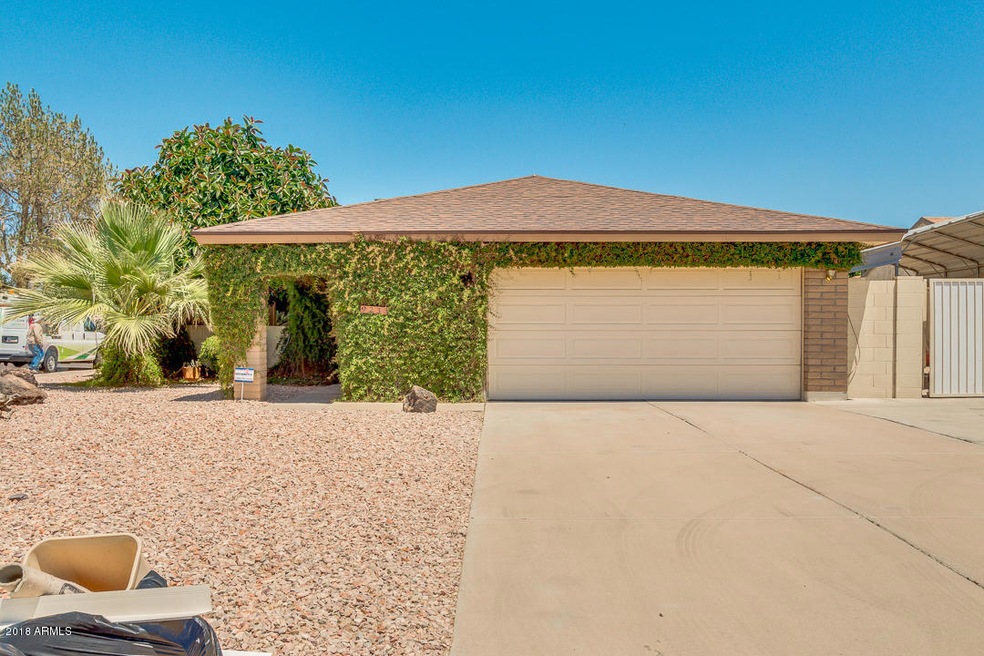
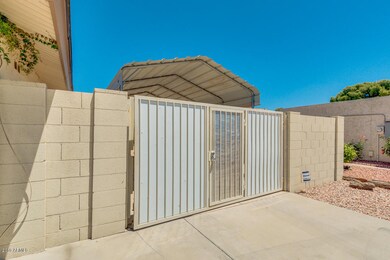
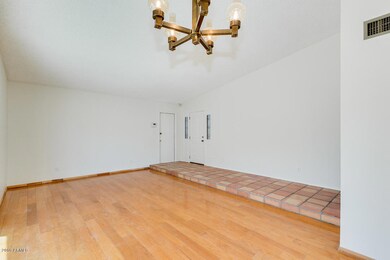
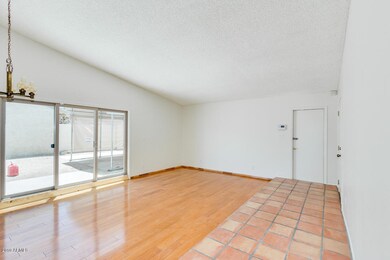
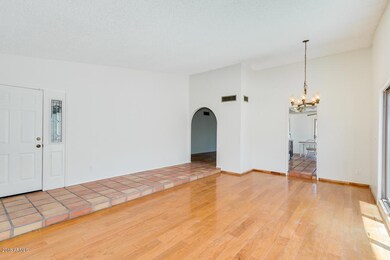
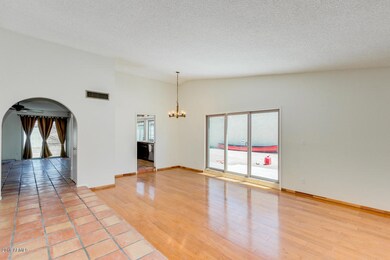
BRING YOUR TOYS!! NO HOA, COVERED PARKING, & Over-sized 2 Car Garage... This HUGE Corner lot features an RV Gate, large grass area, storage shed, and low maintenance front landscaping... This 3 Bedroom, 2 Bath home shows pride of ownership with all the right upgrades. Featuring newer Windows, roof, and air conditioners... Freshly painted and new carpet in bedrooms. Located conveniently to parks, schools, shopping, and so much more!! This one will not last long.
Last Agent to Sell the Property
Mandy Neat
Realty ONE Group License #BR550306000 Listed on: 05/25/2018
Co-Listed By
Rachel Chase
My Home Group Real Estate License #SA645213000
| Date | Buyer | Sale Price | Title Company |
|---|---|---|---|
| Myint Say K | $205,000 | Empire West Title Agency Llc |
| Date | Status | Borrower | Loan Amount |
|---|---|---|---|
| Open | Myint Say K | $187,000 |
| Date | Event | Price | List to Sale | Price per Sq Ft |
|---|---|---|---|---|
| 07/03/2018 07/03/18 | Sold | $205,000 | -2.4% | $135 / Sq Ft |
| 05/28/2018 05/28/18 | Pending | -- | -- | -- |
| 05/25/2018 05/25/18 | For Sale | $210,000 | -- | $138 / Sq Ft |
| Year | Tax Paid | Tax Assessment Tax Assessment Total Assessment is a certain percentage of the fair market value that is determined by local assessors to be the total taxable value of land and additions on the property. | Land | Improvement |
|---|---|---|---|---|
| 2025 | $868 | $11,138 | -- | -- |
| 2024 | $866 | $10,608 | -- | -- |
| 2023 | $866 | $26,500 | $5,300 | $21,200 |
| 2022 | $858 | $20,270 | $4,050 | $16,220 |
| 2021 | $921 | $18,550 | $3,710 | $14,840 |
| 2020 | $935 | $17,020 | $3,400 | $13,620 |
| 2019 | $909 | $15,230 | $3,040 | $12,190 |
| 2018 | $888 | $14,070 | $2,810 | $11,260 |
| 2017 | $894 | $12,370 | $2,470 | $9,900 |
| 2016 | $888 | $11,530 | $2,300 | $9,230 |
| 2015 | $833 | $11,170 | $2,230 | $8,940 |
M
Seller's Agent in 2018
Mandy Neat
Realty One Group
R
Seller Co-Listing Agent in 2018
Rachel Chase
My Home Group Real Estate

Buyer's Agent in 2018
Carolyn Kline
Affirmed Realty
(623) 521-5510
25 in this area
165 Total Sales
Source: Arizona Regional Multiple Listing Service (ARMLS)
MLS Number: 5771710
APN: 148-21-391
Disclaimer: Certain information contained herein is derived from information provided by parties other than Homes.com. All information provided is deemed reliable, but is not guaranteed to be accurate and should be independently verified.
![]() All information should be verified by the recipient and none is guaranteed as accurate by ARMLS
All information should be verified by the recipient and none is guaranteed as accurate by ARMLS
Listing Information presented by local MLS brokerage: Ten-X, local REALTOR®- Arlene Richardson - (888)-952-6393
Ask me questions while you tour the home.