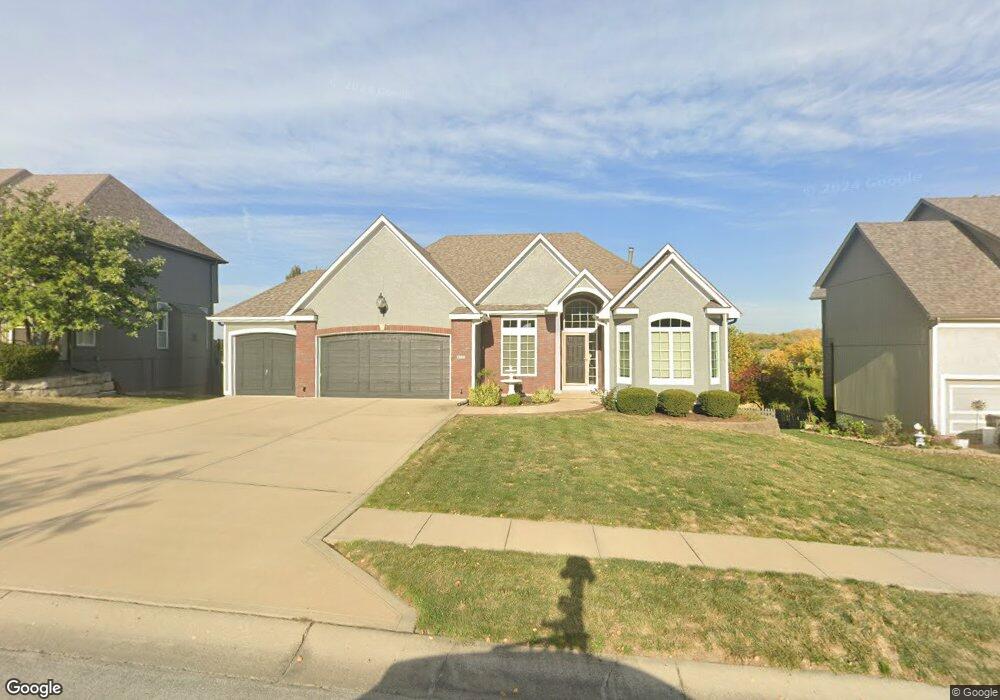
9233 N Laurel Ave Kansas City, MO 64157
Northland NeighborhoodEstimated Value: $489,000 - $569,000
2
Beds
4
Baths
1,961
Sq Ft
$266/Sq Ft
Est. Value
About This Home
This home is located at 9233 N Laurel Ave, Kansas City, MO 64157 and is currently estimated at $520,839, approximately $265 per square foot. 9233 N Laurel Ave is a home located in Clay County with nearby schools including Shoal Creek Elementary School, Discovery Middle School, and Liberty High School.
Ownership History
Date
Name
Owned For
Owner Type
Purchase Details
Closed on
May 6, 2009
Sold by
Swift Cheryl Ruth
Bought by
Swift William J
Current Estimated Value
Purchase Details
Closed on
Jul 22, 2004
Sold by
John Shilt Homes Inc
Bought by
Swift William J and Rohlfs Cheryl R
Home Financials for this Owner
Home Financials are based on the most recent Mortgage that was taken out on this home.
Original Mortgage
$295,500
Outstanding Balance
$148,013
Interest Rate
6.26%
Mortgage Type
Purchase Money Mortgage
Estimated Equity
$372,826
Purchase Details
Closed on
Jan 14, 2004
Sold by
Hunt Midwest Real Estate Development Inc
Bought by
John Shilt Homes Inc
Home Financials for this Owner
Home Financials are based on the most recent Mortgage that was taken out on this home.
Original Mortgage
$308,250
Interest Rate
5.78%
Mortgage Type
Construction
Create a Home Valuation Report for This Property
The Home Valuation Report is an in-depth analysis detailing your home's value as well as a comparison with similar homes in the area
Home Values in the Area
Average Home Value in this Area
Purchase History
| Date | Buyer | Sale Price | Title Company |
|---|---|---|---|
| Swift William J | -- | Missouri Secured Title | |
| Swift William J | -- | Security Land Title Company | |
| John Shilt Homes Inc | -- | Security Land Title Company |
Source: Public Records
Mortgage History
| Date | Status | Borrower | Loan Amount |
|---|---|---|---|
| Open | Swift William J | $295,500 | |
| Previous Owner | John Shilt Homes Inc | $308,250 | |
| Closed | Swift William J | $25,000 |
Source: Public Records
Tax History Compared to Growth
Tax History
| Year | Tax Paid | Tax Assessment Tax Assessment Total Assessment is a certain percentage of the fair market value that is determined by local assessors to be the total taxable value of land and additions on the property. | Land | Improvement |
|---|---|---|---|---|
| 2025 | $6,925 | $91,710 | -- | -- |
| 2024 | $6,925 | $82,760 | -- | -- |
| 2023 | $6,986 | $82,760 | $0 | $0 |
| 2022 | $6,427 | $73,680 | $0 | $0 |
| 2021 | $6,455 | $73,682 | $12,540 | $61,142 |
| 2020 | $6,157 | $66,690 | $0 | $0 |
| 2019 | $6,050 | $66,690 | $0 | $0 |
| 2018 | $5,793 | $62,720 | $0 | $0 |
| 2017 | $5,490 | $62,720 | $9,500 | $53,220 |
| 2016 | $5,490 | $60,590 | $9,500 | $51,090 |
| 2015 | $5,484 | $60,590 | $9,500 | $51,090 |
| 2014 | $5,302 | $58,240 | $9,500 | $48,740 |
Source: Public Records
Map
Nearby Homes
- 9007 NE 92nd Terrace
- 8908 NE 94th St
- 8909 NE 95th Ct
- 9027 N Manning Ave
- 9008 N Hunter Ave
- 9001 N Manning Ave
- 9020 N Oxford Ave
- 8904 NE 89th St
- 9411 NE 91st Terrace
- 9105 N Evanston Ave
- 8817 N Farley Ave
- 8713 N Farley Ave
- 8722 N Farley Ave
- 8734 N Farley Ave
- 8664 NE 97th St
- 9612 NE 95th Terrace
- 8830 N Glenwood Ave
- 9808 N Laurel Ave
- 8662 NE 97th Terrace
- 9720 N Denton Ave
- 9229 N Laurel Ave
- 9237 N Laurel Ave
- 9225 N Laurel Ave
- 9241 N Laurel Ave
- 9234 N Laurel Ave
- 9236 N Laurel Ave
- 9228 N Laurel Ave
- 9221 N Laurel Ave
- 9315 N Kentucky Ave
- 9226 N Laurel Ave
- 9243 N Laurel Ave
- 9311 N Kentucky Ave
- 9007 NE 94th Place
- 9003 NE 94th Place
- 9222 N Laurel Ave
- 9231 N Manning Ave
- 9227 N Manning Ave
- 9217 N Laurel Ave
- 9015 NE 94th Place
- 9223 N Manning Ave