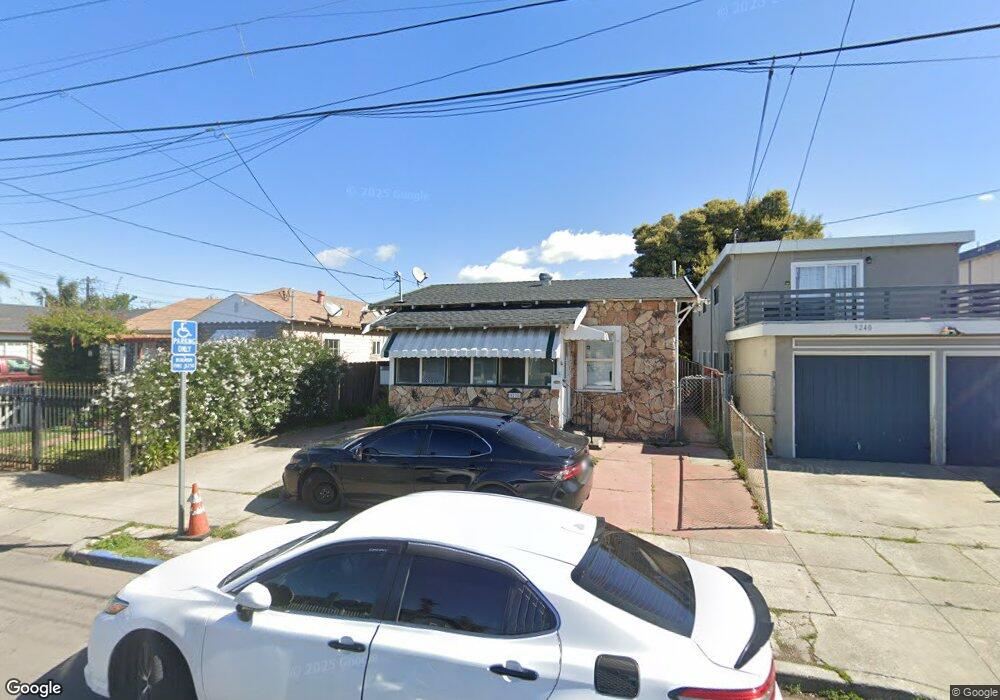
9238 C St Oakland, CA 94603
Elmhurst Park NeighborhoodEstimated Value: $272,000 - $400,206
1
Bed
1
Bath
700
Sq Ft
$517/Sq Ft
Est. Value
About This Home
This home is located at 9238 C St, Oakland, CA 94603 and is currently estimated at $361,802, approximately $516 per square foot. 9238 C St is a home located in Alameda County with nearby schools including New Highland Academy, Acorn Woodland Elementary School, and Encompass Academy Elementary.
Ownership History
Date
Name
Owned For
Owner Type
Purchase Details
Closed on
Sep 25, 2018
Sold by
Phillips Brenda and The Helen E Bookman Trust
Bought by
Padilla Jairo
Current Estimated Value
Home Financials for this Owner
Home Financials are based on the most recent Mortgage that was taken out on this home.
Original Mortgage
$236,000
Outstanding Balance
$205,806
Interest Rate
4.5%
Mortgage Type
New Conventional
Estimated Equity
$155,996
Purchase Details
Closed on
Nov 29, 2007
Sold by
Bookman Helen E
Bought by
Bookman Helen E and The Helen E Bookman Trust
Create a Home Valuation Report for This Property
The Home Valuation Report is an in-depth analysis detailing your home's value as well as a comparison with similar homes in the area
Home Values in the Area
Average Home Value in this Area
Purchase History
| Date | Buyer | Sale Price | Title Company |
|---|---|---|---|
| Padilla Jairo | $295,000 | Chicago Title Company | |
| Bookman Helen E | -- | None Available |
Source: Public Records
Mortgage History
| Date | Status | Borrower | Loan Amount |
|---|---|---|---|
| Open | Padilla Jairo | $236,000 |
Source: Public Records
Tax History Compared to Growth
Tax History
| Year | Tax Paid | Tax Assessment Tax Assessment Total Assessment is a certain percentage of the fair market value that is determined by local assessors to be the total taxable value of land and additions on the property. | Land | Improvement |
|---|---|---|---|---|
| 2025 | $6,061 | $329,071 | $98,721 | $230,350 |
| 2024 | $6,061 | $322,620 | $96,786 | $225,834 |
| 2023 | $5,898 | $316,295 | $94,888 | $221,407 |
| 2022 | $5,698 | $310,094 | $93,028 | $217,066 |
| 2021 | $5,353 | $304,014 | $91,204 | $212,810 |
| 2020 | $5,531 | $300,900 | $90,270 | $210,630 |
| 2019 | $5,271 | $295,000 | $88,500 | $206,500 |
| 2018 | $1,209 | $24,349 | $11,205 | $13,144 |
| 2017 | $1,112 | $23,871 | $10,985 | $12,886 |
| 2016 | $1,082 | $23,404 | $10,770 | $12,634 |
| 2015 | $1,189 | $23,052 | $10,608 | $12,444 |
| 2014 | $1,070 | $22,600 | $10,400 | $12,200 |
Source: Public Records
Map
Nearby Homes