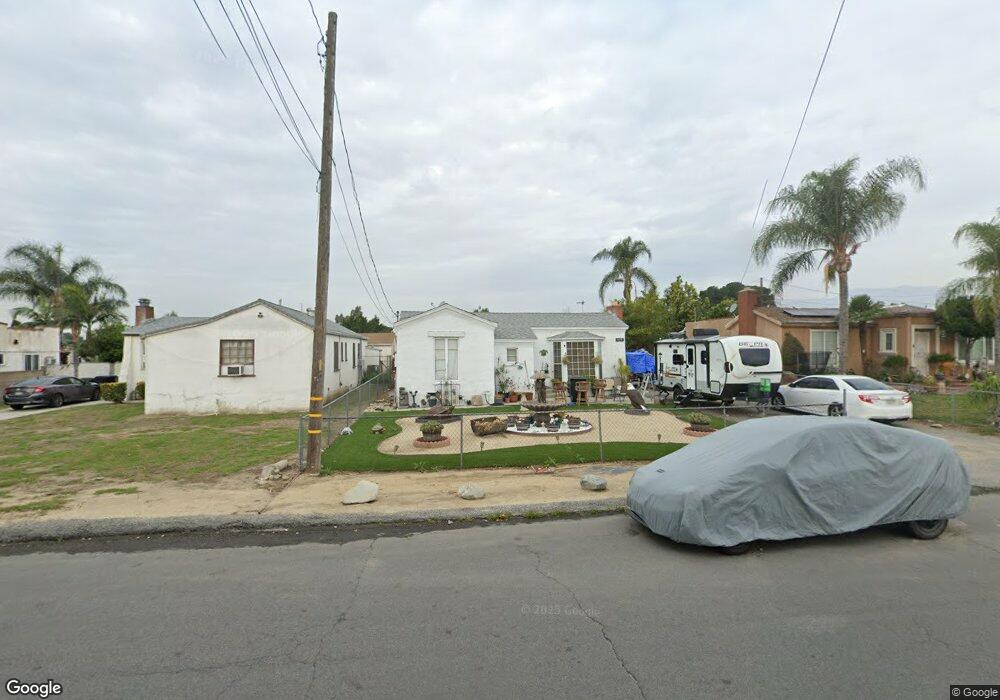
9238 Maple Ave Fontana, CA 92335
Estimated Value: $477,144 - $565,000
2
Beds
1
Bath
1,212
Sq Ft
$429/Sq Ft
Est. Value
About This Home
This home is located at 9238 Maple Ave, Fontana, CA 92335 and is currently estimated at $520,286, approximately $429 per square foot. 9238 Maple Ave is a home located in San Bernardino County with nearby schools including Maple Elementary School, Alder Middle School, and Jurupa Hills High School.
Ownership History
Date
Name
Owned For
Owner Type
Purchase Details
Closed on
Oct 15, 2003
Sold by
Taylor Eric D
Bought by
Taylor Eric D and Taylor Gail
Current Estimated Value
Home Financials for this Owner
Home Financials are based on the most recent Mortgage that was taken out on this home.
Original Mortgage
$87,170
Interest Rate
5.5%
Mortgage Type
New Conventional
Purchase Details
Closed on
Apr 30, 1996
Sold by
Taylor Gail Lorraine
Bought by
Taylor Eric D
Home Financials for this Owner
Home Financials are based on the most recent Mortgage that was taken out on this home.
Original Mortgage
$65,184
Interest Rate
7.82%
Mortgage Type
FHA
Create a Home Valuation Report for This Property
The Home Valuation Report is an in-depth analysis detailing your home's value as well as a comparison with similar homes in the area
Home Values in the Area
Average Home Value in this Area
Purchase History
| Date | Buyer | Sale Price | Title Company |
|---|---|---|---|
| Taylor Eric D | -- | First American | |
| Taylor Eric D | -- | United Title |
Source: Public Records
Mortgage History
| Date | Status | Borrower | Loan Amount |
|---|---|---|---|
| Closed | Taylor Eric D | $87,170 | |
| Closed | Taylor Eric D | $65,184 |
Source: Public Records
Tax History
| Year | Tax Paid | Tax Assessment Tax Assessment Total Assessment is a certain percentage of the fair market value that is determined by local assessors to be the total taxable value of land and additions on the property. | Land | Improvement |
|---|---|---|---|---|
| 2025 | $1,314 | $91,401 | $32,497 | $58,904 |
| 2024 | $1,666 | $89,609 | $31,860 | $57,749 |
| 2023 | $861 | $87,852 | $31,235 | $56,617 |
| 2022 | $856 | $86,130 | $30,623 | $55,507 |
| 2021 | $4,570 | $84,442 | $30,023 | $54,419 |
| 2020 | $4,567 | $83,576 | $29,715 | $53,861 |
| 2019 | $4,529 | $81,937 | $29,132 | $52,805 |
| 2018 | $4,540 | $80,331 | $28,561 | $51,770 |
| 2017 | $4,534 | $78,756 | $28,001 | $50,755 |
| 2016 | $804 | $77,212 | $27,452 | $49,760 |
| 2015 | $793 | $76,053 | $27,040 | $49,013 |
| 2014 | $792 | $74,563 | $26,510 | $48,053 |
Source: Public Records
Map
Nearby Homes
- 868 S Ironwood Ave
- 9050 Dumond Dr
- 1459 W James St
- 9454 Frankfort Ave
- 839 S Aspen Ave
- 18605 Sequoia Ave
- 9431 Laurel Ave
- 9416 Cedar Ave
- 1510 W Merrill Ave
- 9543 Laurel Ave
- 9087 Rosecrest Ln
- 18087 San Bernardino Ave
- 17875 Merrill Ave
- 504 S Quince Ave
- 8787 Locust Ave Unit 24
- 8787 Locust Ave Unit 69
- 8787 Locust Ave Unit 130
- 8787 Locust Ave Unit 1
- 18325 El Molino St
- 9824 Linden Ave
- 9228 Maple Ave
- 9248 Maple Ave
- 9252 Maple Ave
- 9218 Maple Ave
- 1685 Pinedale Ave
- 9256 Maple Ave
- 847 S Maple Ave
- 809 S Maple Ave
- 857 S Maple Ave
- 1678 Pinedale Ave
- 9268 Maple Ave
- 1667 Pinedale Ave
- 18292 Pine Ave
- 867 S Maple Ave
- 848 S Ashford Ave
- 18237 Pine Ave
- 1668 Pinedale Ave
- 18268 Pine Ave
- 858 S Ashford Ave
- 9278 Maple Ave
Your Personal Tour Guide
Ask me questions while you tour the home.