Estimated Value: $114,639 - $153,000
4
Beds
2
Baths
864
Sq Ft
$158/Sq Ft
Est. Value
About This Home
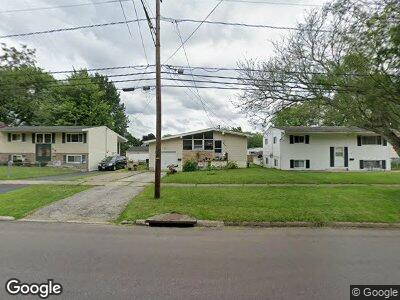
This home is located at 924 Carnegie Ave, Akron, OH 44314 and is currently estimated at $136,160, approximately $157 per square foot. 924 Carnegie Ave is a home located in Summit County with nearby schools including Imagine Akron Academy, St. Francis de Sales School, and Sam Salem Community Learning Center.
Ownership History
Date
Name
Owned For
Owner Type
Purchase Details
Closed on
Aug 31, 2020
Sold by
Wysocki Rebecca and The Rentco Revocable Living Tr
Bought by
Wysocki Rebecca A
Current Estimated Value
Purchase Details
Closed on
Aug 3, 2018
Sold by
Spencer Sebastain
Bought by
Abbott Sherry R
Home Financials for this Owner
Home Financials are based on the most recent Mortgage that was taken out on this home.
Original Mortgage
$37,300
Outstanding Balance
$32,727
Interest Rate
4.5%
Mortgage Type
Purchase Money Mortgage
Estimated Equity
$103,465
Purchase Details
Closed on
May 10, 2013
Sold by
Tentco Trust
Bought by
Spencer James and Abbott Sherry
Purchase Details
Closed on
Feb 5, 2013
Sold by
Wiggins Joe M
Bought by
Wysocki Rebecca and Rentco Trust
Purchase Details
Closed on
Jul 20, 2005
Sold by
Estate Of Pauline Wiggins
Bought by
Wiggins Joe M
Create a Home Valuation Report for This Property
The Home Valuation Report is an in-depth analysis detailing your home's value as well as a comparison with similar homes in the area
Home Values in the Area
Average Home Value in this Area
Purchase History
| Date | Buyer | Sale Price | Title Company |
|---|---|---|---|
| Wysocki Rebecca A | -- | None Available | |
| Abbott Sherry R | -- | None Available | |
| Spencer James | $23,000 | None Available | |
| Wysocki Rebecca | $23,100 | None Available | |
| Wiggins Joe M | -- | -- |
Source: Public Records
Mortgage History
| Date | Status | Borrower | Loan Amount |
|---|---|---|---|
| Open | Abbott Sherry R | $37,300 | |
| Previous Owner | Wiggins Joe M | $50,000 | |
| Closed | Spencer James | $0 |
Source: Public Records
Tax History Compared to Growth
Tax History
| Year | Tax Paid | Tax Assessment Tax Assessment Total Assessment is a certain percentage of the fair market value that is determined by local assessors to be the total taxable value of land and additions on the property. | Land | Improvement |
|---|---|---|---|---|
| 2025 | $2,065 | $37,321 | $7,879 | $29,442 |
| 2024 | $2,065 | $37,321 | $7,879 | $29,442 |
| 2023 | $2,065 | $37,321 | $7,879 | $29,442 |
| 2022 | $1,653 | $23,181 | $4,893 | $18,288 |
| 2021 | $1,655 | $23,181 | $4,893 | $18,288 |
| 2020 | $1,631 | $23,180 | $4,890 | $18,290 |
| 2019 | $1,792 | $21,900 | $4,750 | $17,150 |
| 2018 | $1,622 | $21,900 | $4,750 | $17,150 |
| 2017 | $1,611 | $21,900 | $4,750 | $17,150 |
| 2016 | $1,612 | $20,060 | $4,750 | $15,310 |
| 2015 | $1,611 | $20,060 | $4,750 | $15,310 |
| 2014 | $1,599 | $20,060 | $4,750 | $15,310 |
| 2013 | $2,172 | $23,870 | $4,750 | $19,120 |
Source: Public Records
Map
Nearby Homes
- 985 Winston St
- 859 Sutherland Ave
- 2983 Saralee Ave
- 2976 Greer Rd
- 288 Kohler Ave
- 1235 Sevilla Ave
- 3143 Ethan Allen Rd
- 3153 Ethan Allen Rd
- 32 Joyce Ave
- 0 Joyce Ave NW Unit 35 5043152
- 0 Joyce Ave NW Unit 34 5043158
- 2984 Manchester Rd
- 1160 Mcintosh Ave
- 1292 Tampa Ave
- 665 Cove Blvd
- 625 Cove Blvd
- 632 Cove Blvd
- 517 E State St
- 0 E State St
- 801 E Paige Ave
- 924 Carnegie Ave
- 918 Carnegie Ave
- 936 Carnegie Ave
- 914 Carnegie Ave
- 923 Winston St
- 929 Winston St
- 940 Carnegie Ave
- 919 Winston St
- 2872 Pikes Ave
- 935 Winston St
- 908 Carnegie Ave
- 913 Winston St
- 935 Carnegie Ave
- 2875 Pikes Ave
- 946 Carnegie Ave
- 941 Winston St
- 941 Carnegie Ave
- 941 Carnegie Ave
- 902 Carnegie Ave
- 902 Carnegie Ave