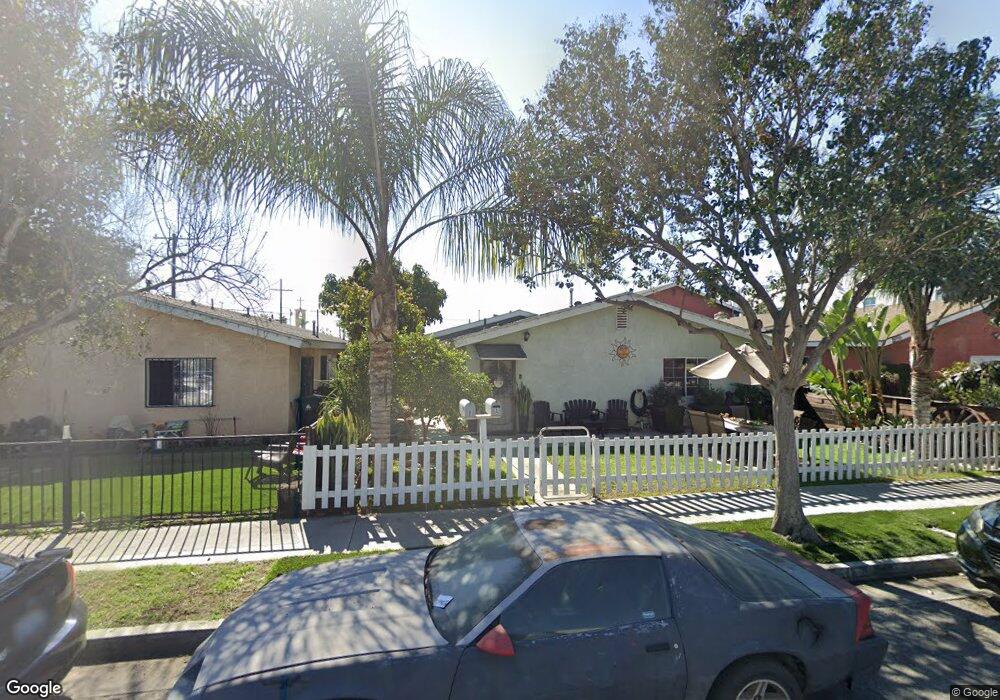
924 E M St Wilmington, CA 90744
Estimated Value: $765,000 - $1,008,000
4
Beds
2
Baths
2,304
Sq Ft
$375/Sq Ft
Est. Value
About This Home
This home is located at 924 E M St, Wilmington, CA 90744 and is currently estimated at $864,428, approximately $375 per square foot. 924 E M St is a home located in Los Angeles County with nearby schools including Wilmington Park Elementary, Wilmington Middle School STEAM Magnet, and Phineas Banning Senior High School.
Ownership History
Date
Name
Owned For
Owner Type
Purchase Details
Closed on
Apr 3, 2017
Sold by
Tegel
Bought by
Tegel
Current Estimated Value
Home Financials for this Owner
Home Financials are based on the most recent Mortgage that was taken out on this home.
Interest Rate
4.14%
Purchase Details
Closed on
Mar 30, 1999
Sold by
Lopez Armando
Bought by
Moreno Carlos
Purchase Details
Closed on
Sep 4, 1998
Sold by
Lopez Maria S
Bought by
Lopez Armando
Home Financials for this Owner
Home Financials are based on the most recent Mortgage that was taken out on this home.
Original Mortgage
$40,000
Interest Rate
6.92%
Mortgage Type
Seller Take Back
Purchase Details
Closed on
May 9, 1994
Sold by
Purdue Billy Caple
Bought by
Purdue Jones Dagmar
Purchase Details
Closed on
Apr 29, 1994
Sold by
Wells Fargo Bank Na
Bought by
Chavez Miguel C and Chavez Elodia T
Create a Home Valuation Report for This Property
The Home Valuation Report is an in-depth analysis detailing your home's value as well as a comparison with similar homes in the area
Home Values in the Area
Average Home Value in this Area
Purchase History
| Date | Buyer | Sale Price | Title Company |
|---|---|---|---|
| Tegel | -- | -- | |
| Moreno Carlos | -- | -- | |
| Lopez Armando | -- | -- | |
| Moreno Carlos | -- | -- | |
| Moreno Carlos | $80,000 | American Title Co | |
| Purdue Jones Dagmar | -- | Gateway Title Company | |
| Chavez Miguel C | $80,000 | Gateway Title Company |
Source: Public Records
Mortgage History
| Date | Status | Borrower | Loan Amount |
|---|---|---|---|
| Closed | Tegel | -- | |
| Previous Owner | Moreno Carlos | $40,000 |
Source: Public Records
Tax History Compared to Growth
Tax History
| Year | Tax Paid | Tax Assessment Tax Assessment Total Assessment is a certain percentage of the fair market value that is determined by local assessors to be the total taxable value of land and additions on the property. | Land | Improvement |
|---|---|---|---|---|
| 2025 | $3,004 | $206,405 | $62,695 | $143,710 |
| 2024 | $3,004 | $202,359 | $61,466 | $140,893 |
| 2023 | $2,949 | $198,392 | $60,261 | $138,131 |
| 2022 | $2,815 | $194,503 | $59,080 | $135,423 |
| 2021 | $2,764 | $190,690 | $57,922 | $132,768 |
| 2019 | $2,683 | $185,036 | $56,205 | $128,831 |
| 2018 | $2,578 | $181,408 | $55,103 | $126,305 |
| 2016 | $2,357 | $174,365 | $52,964 | $121,401 |
| 2015 | $2,324 | $171,747 | $52,169 | $119,578 |
| 2014 | $2,341 | $168,384 | $51,148 | $117,236 |
Source: Public Records
Map
Nearby Homes
- 1125 Dominguez Ave
- 914 E O St
- 1119 E Colon St
- 1311 E Pacific Coast Hwy Unit 2
- 900 E Denni St Unit 43
- 1319 E Colon St
- 1437 E Colon St
- 915 Flint Ave
- 908 Mcfarland Ave
- 1046 N Banning Blvd
- 1353 Lakme Ave
- 1526 Lakme Ave
- 939 Vreeland Ave
- 1610 Broad Ave
- 235 E Anaheim St
- 1627 Broad Ave
- 1210 1212 E Cruces
- 1112 Island Ave
- 1610 N Fries Ave
- 323 Ross Place
- 928 E M St
- 916 E M St
- 912 E M St
- 923 E Robidoux St
- 929 E Robidoux St
- 919 E Robidoux St
- 1000 E M St
- 915 E Robidoux St
- 1004 E M St
- 1003 E Robidoux St
- 1008 E M St
- 1005 E Robidoux St
- 1254 Sanford Ave
- 1007 E Robidoux St
- 1007 E M St
- 1011 E Robidoux St
- 1014 E M St
- 1011 E M St
- 1015 E Robidoux St
- 1018 E M St