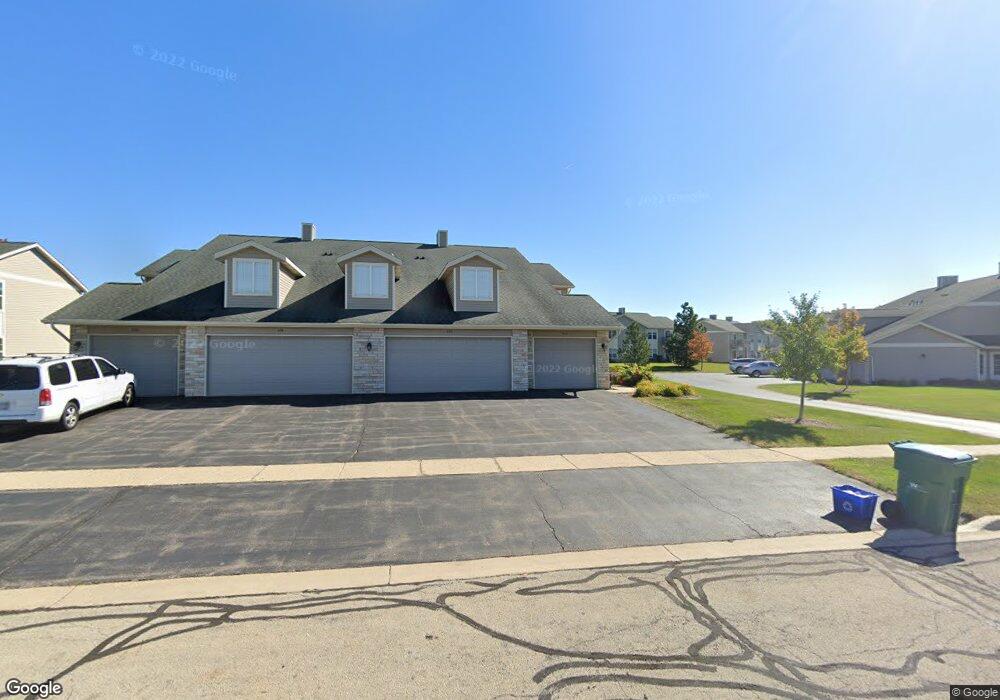
924 Kelly Ln Sycamore, IL 60178
Estimated Value: $223,173 - $227,000
2
Beds
2
Baths
1,368
Sq Ft
$165/Sq Ft
Est. Value
About This Home
This home is located at 924 Kelly Ln, Sycamore, IL 60178 and is currently estimated at $225,293, approximately $164 per square foot. 924 Kelly Ln is a home located in DeKalb County with nearby schools including Sycamore High School, St Mary's Catholic School, and Cornerstone Christian Academy.
Ownership History
Date
Name
Owned For
Owner Type
Purchase Details
Closed on
Oct 1, 2021
Sold by
Hardy Karen C
Bought by
Hardy Karen C and Karen C Hardy Trust
Current Estimated Value
Purchase Details
Closed on
Nov 12, 2010
Sold by
Stearns Robert E
Bought by
Hardy Karen C
Home Financials for this Owner
Home Financials are based on the most recent Mortgage that was taken out on this home.
Original Mortgage
$80,000
Outstanding Balance
$52,890
Interest Rate
4.31%
Mortgage Type
New Conventional
Estimated Equity
$172,403
Purchase Details
Closed on
Jan 16, 2007
Sold by
Medine Gerald R
Bought by
Stearns Robert E and Stearns Toni K
Home Financials for this Owner
Home Financials are based on the most recent Mortgage that was taken out on this home.
Original Mortgage
$50,000
Interest Rate
6.21%
Mortgage Type
New Conventional
Create a Home Valuation Report for This Property
The Home Valuation Report is an in-depth analysis detailing your home's value as well as a comparison with similar homes in the area
Home Values in the Area
Average Home Value in this Area
Purchase History
| Date | Buyer | Sale Price | Title Company |
|---|---|---|---|
| Hardy Karen C | -- | Accommodation | |
| Hardy Karen C | $130,500 | -- | |
| Stearns Robert E | $141,000 | -- |
Source: Public Records
Mortgage History
| Date | Status | Borrower | Loan Amount |
|---|---|---|---|
| Open | Hardy Karen C | $80,000 | |
| Previous Owner | Stearns Robert E | $50,000 |
Source: Public Records
Tax History Compared to Growth
Tax History
| Year | Tax Paid | Tax Assessment Tax Assessment Total Assessment is a certain percentage of the fair market value that is determined by local assessors to be the total taxable value of land and additions on the property. | Land | Improvement |
|---|---|---|---|---|
| 2024 | $1,794 | $58,063 | $14,517 | $43,546 |
| 2023 | $1,794 | $53,020 | $13,256 | $39,764 |
| 2022 | $1,879 | $48,629 | $12,158 | $36,471 |
| 2021 | $1,913 | $45,653 | $11,414 | $34,239 |
| 2020 | $2,133 | $44,530 | $11,133 | $33,397 |
| 2019 | $1,951 | $43,554 | $10,889 | $32,665 |
| 2018 | $2,183 | $42,233 | $10,559 | $31,674 |
| 2017 | $2,020 | $40,562 | $10,141 | $30,421 |
| 2016 | $2,073 | $38,711 | $9,678 | $29,033 |
| 2015 | -- | $34,570 | $8,793 | $25,777 |
| 2014 | -- | $32,827 | $8,350 | $24,477 |
| 2013 | -- | $33,456 | $8,510 | $24,946 |
Source: Public Records
Map
Nearby Homes
- 56 Briden Ln Unit 56
- Blue Bell Plan at Old Mill Park Condos
- Sun Flower Plan at Old Mill Park Condos
- Prairie Rose Plan at Old Mill Park Condos
- Cone Flower Plan at Old Mill Park Condos
- 1071 Alexandria Dr
- 22 Kloe Ln Unit 22
- 18 Kloe Ln Unit 18
- 955 Buckingham Dr
- 1148 Rose Dr
- 13 Briden Ln Unit 13
- 44 Kloe Ln Unit 44
- 1147 Alexandria Dr
- 64 Kloe Ln Unit 64
- 134 Brian St
- 1340 N Main St
- 1310 Arneita St
- 528 E Sycamore St
- TBD Plaza Dr
- TBD Aberdeen Ct
- 926 Kelly Ln
- 920 Kelly Ln
- 925 Kelly Ln Unit 925
- 944 Kelly Ln
- 921 Kelly Ln Unit 921
- 922 Kelly Ln
- 942 Kelly Ln
- 906 Kelly Ln
- 904 Kelly Ln
- 940 Kelly Ln
- 946 Kelly Ln
- 941 Kelly Ln Unit 941
- 923 Kelly Ln Unit 923
- 945 Kelly Ln Unit 945
- 927 Kelly Ln Unit 927
- 947 Kelly Ln Unit 947
- 947 Kelly Ln Unit 1
- 900 Kelly Ln
- 943 Kelly Ln Unit 943
- 964 Kelly Ln