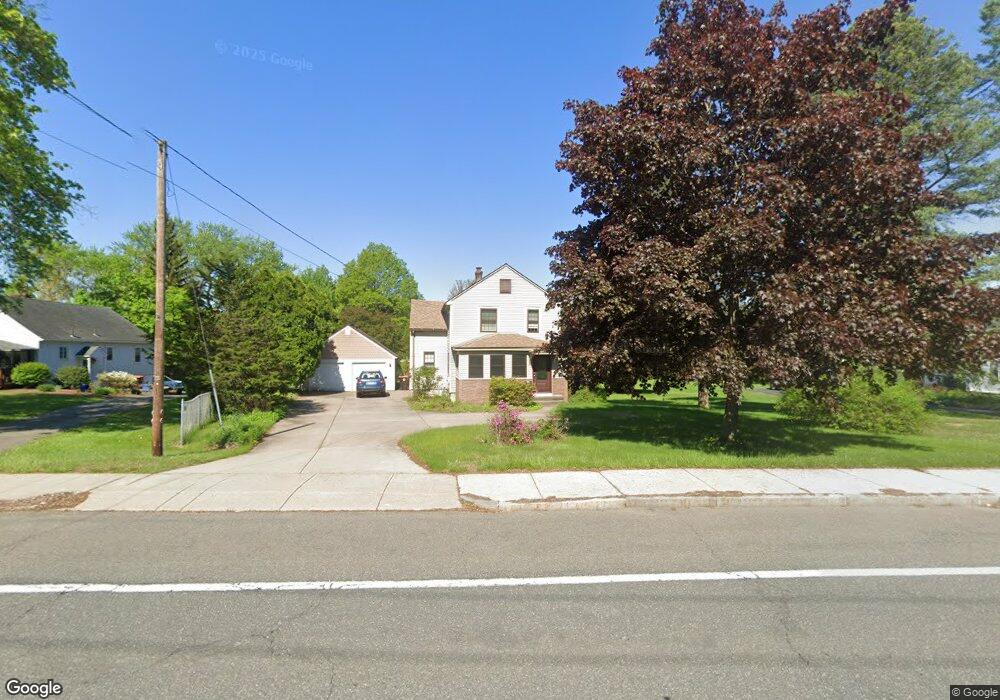
924 Main St Agawam, MA 01001
Estimated Value: $393,124 - $418,000
3
Beds
2
Baths
2,230
Sq Ft
$181/Sq Ft
Est. Value
About This Home
This home is located at 924 Main St, Agawam, MA 01001 and is currently estimated at $403,281, approximately $180 per square foot. 924 Main St is a home located in Hampden County with nearby schools including Agawam Junior High School, Agawam High School, and St Thomas The Apostle School.
Ownership History
Date
Name
Owned For
Owner Type
Purchase Details
Closed on
Mar 15, 2024
Sold by
Norgaard Ft and Norgaard
Bought by
Norgaard Sean W
Current Estimated Value
Purchase Details
Closed on
Dec 19, 2016
Sold by
Norgaard Geraldine M and Norgaard Gerald B
Bought by
Norgaard Ft and Norgaard
Purchase Details
Closed on
Jun 26, 1992
Sold by
Wright Sadie E and Wright Harold S
Bought by
Norgaard Gerald B and Norgaard Geraldine
Create a Home Valuation Report for This Property
The Home Valuation Report is an in-depth analysis detailing your home's value as well as a comparison with similar homes in the area
Home Values in the Area
Average Home Value in this Area
Purchase History
| Date | Buyer | Sale Price | Title Company |
|---|---|---|---|
| Norgaard Sean W | -- | None Available | |
| Norgaard Ft | -- | -- | |
| Norgaard Ft | -- | -- | |
| Norgaard Gerald B | $1,500 | -- |
Source: Public Records
Mortgage History
| Date | Status | Borrower | Loan Amount |
|---|---|---|---|
| Previous Owner | Norgaard Gerald B | $25,000 | |
| Previous Owner | Norgaard Gerald B | $27,000 |
Source: Public Records
Tax History
| Year | Tax Paid | Tax Assessment Tax Assessment Total Assessment is a certain percentage of the fair market value that is determined by local assessors to be the total taxable value of land and additions on the property. | Land | Improvement |
|---|---|---|---|---|
| 2025 | $4,489 | $306,600 | $109,100 | $197,500 |
| 2024 | $4,352 | $299,300 | $109,100 | $190,200 |
| 2023 | $4,010 | $254,100 | $89,600 | $164,500 |
| 2022 | $3,683 | $228,600 | $89,600 | $139,000 |
| 2021 | $3,523 | $209,700 | $77,200 | $132,500 |
| 2020 | $3,416 | $203,000 | $76,100 | $126,900 |
| 2019 | $3,270 | $196,400 | $74,500 | $121,900 |
| 2018 | $3,111 | $187,300 | $74,500 | $112,800 |
| 2017 | $2,949 | $180,800 | $74,500 | $106,300 |
| 2016 | $2,925 | $180,800 | $74,500 | $106,300 |
| 2015 | $2,777 | $176,400 | $74,500 | $101,900 |
Source: Public Records
Map
Nearby Homes
- 1026 Main St
- 4H Mapleviewlane Unit 4H
- 1077 Main St
- 0 Silver St
- 238 Elm St
- 13 Castle Hills Rd Unit B
- 15 B Castle Hills Rd Unit B
- 2 Sabrina Way Unit D
- 762 Suffield St
- 42 Anthony St
- 144 River Rd
- 178 Beekman Dr
- 105 Edgewater Rd
- 47 Corey Colonial
- 1026 Suffield St
- 190 Mill St
- 49 South St
- 88 Country Rd
- 712 Cooper St
- 48 Cosgrove Ave
Your Personal Tour Guide
Ask me questions while you tour the home.