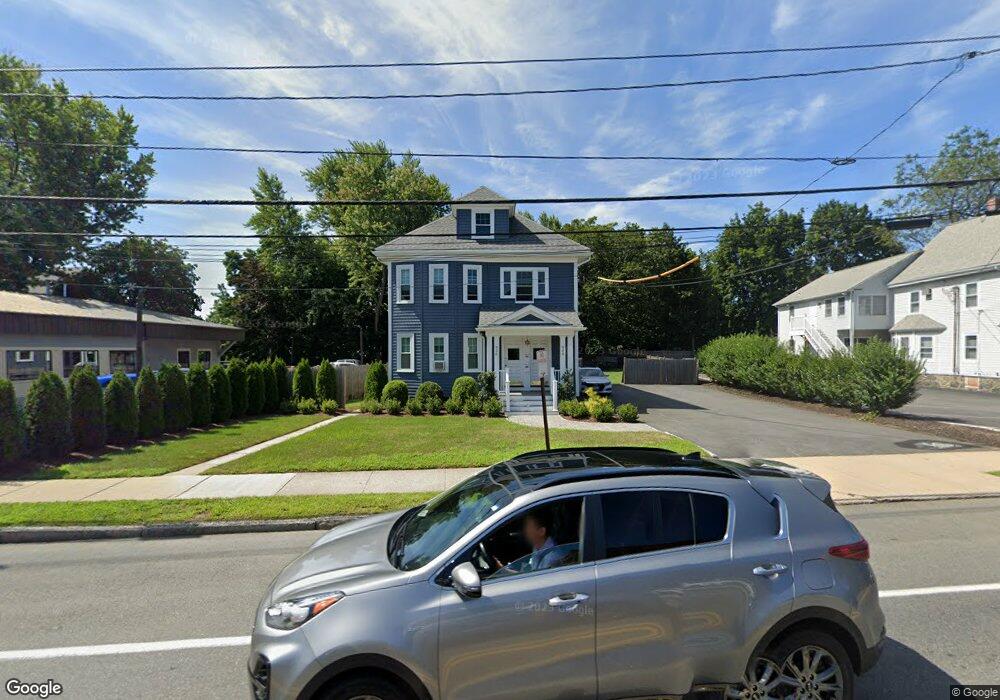
924 Main St Unit 926 Winchester, MA 01890
North Main NeighborhoodEstimated Value: $1,076,000 - $1,304,413
2
Beds
1
Bath
1,050
Sq Ft
$1,142/Sq Ft
Est. Value
About This Home
This home is located at 924 Main St Unit 926, Winchester, MA 01890 and is currently estimated at $1,198,603, approximately $1,141 per square foot. 924 Main St Unit 926 is a home located in Middlesex County with nearby schools including Lynch Elementary School, McCall Middle School, and Winchester High School.
Ownership History
Date
Name
Owned For
Owner Type
Purchase Details
Closed on
Nov 25, 2020
Sold by
Mcdonough-Ford Ft
Bought by
Main Street Obrien Llc
Current Estimated Value
Home Financials for this Owner
Home Financials are based on the most recent Mortgage that was taken out on this home.
Original Mortgage
$400,000
Outstanding Balance
$356,754
Interest Rate
2.8%
Mortgage Type
New Conventional
Estimated Equity
$841,849
Create a Home Valuation Report for This Property
The Home Valuation Report is an in-depth analysis detailing your home's value as well as a comparison with similar homes in the area
Home Values in the Area
Average Home Value in this Area
Purchase History
| Date | Buyer | Sale Price | Title Company |
|---|---|---|---|
| Main Street Obrien Llc | $820,000 | None Available |
Source: Public Records
Mortgage History
| Date | Status | Borrower | Loan Amount |
|---|---|---|---|
| Open | Main Street Obrien Llc | $400,000 |
Source: Public Records
Tax History Compared to Growth
Tax History
| Year | Tax Paid | Tax Assessment Tax Assessment Total Assessment is a certain percentage of the fair market value that is determined by local assessors to be the total taxable value of land and additions on the property. | Land | Improvement |
|---|---|---|---|---|
| 2025 | $116 | $1,045,300 | $490,900 | $554,400 |
| 2024 | $11,688 | $1,031,600 | $490,900 | $540,700 |
| 2023 | $10,455 | $886,000 | $429,500 | $456,500 |
| 2022 | $9,757 | $779,900 | $368,200 | $411,700 |
| 2021 | $8,252 | $643,200 | $345,100 | $298,100 |
| 2020 | $7,969 | $643,200 | $345,100 | $298,100 |
| 2019 | $6,232 | $514,600 | $249,300 | $265,300 |
| 2018 | $6,197 | $508,400 | $243,100 | $265,300 |
| 2017 | $6,243 | $508,400 | $243,100 | $265,300 |
| 2016 | $5,533 | $473,700 | $243,100 | $230,600 |
| 2015 | $5,481 | $451,500 | $220,900 | $230,600 |
| 2014 | $5,251 | $414,800 | $184,100 | $230,700 |
Source: Public Records
Map
Nearby Homes
- 29 Shepard Ct
- 20 Arthur St
- 237 Swanton St
- 62 Richardson St
- 14 Cross St
- 149 Horn Pond Brook Rd
- 200 Swanton St Unit 228
- 200 Swanton St Unit 636
- 200 Swanton St Unit 234
- 200 Swanton St Unit T28
- 171 Swanton St Unit 73
- 2 George Rd Unit 2
- 9 Norfolk Rd
- 32 Woodside Rd
- 95 Irving St
- 666 Main St Unit 312
- 666 Main St Unit 315
- 14 Ash St
- 6 Ivy Cir
- 36 Elmwood Ave Unit 2
- 926 Main St Unit 926
- 922 Main St
- 940 Main St Unit 942
- 942 Main St Unit 2
- 910 Main St
- 910 Main St Unit 2
- 99 Hemingway St Unit 101
- 19 Canal St
- 955 Main St Unit 209
- 955 Main St Unit 207
- 955 Main St Unit 204
- 955 Main St Unit 304
- 955 Main St Unit G1
- 955 Main St Unit 305
- 955 Main St Unit G3
- 955 Main St Unit 306
- 955 Main St
- 907 Main St Unit 8
- 907 Main St Unit 7
- 907 Main St Unit 6