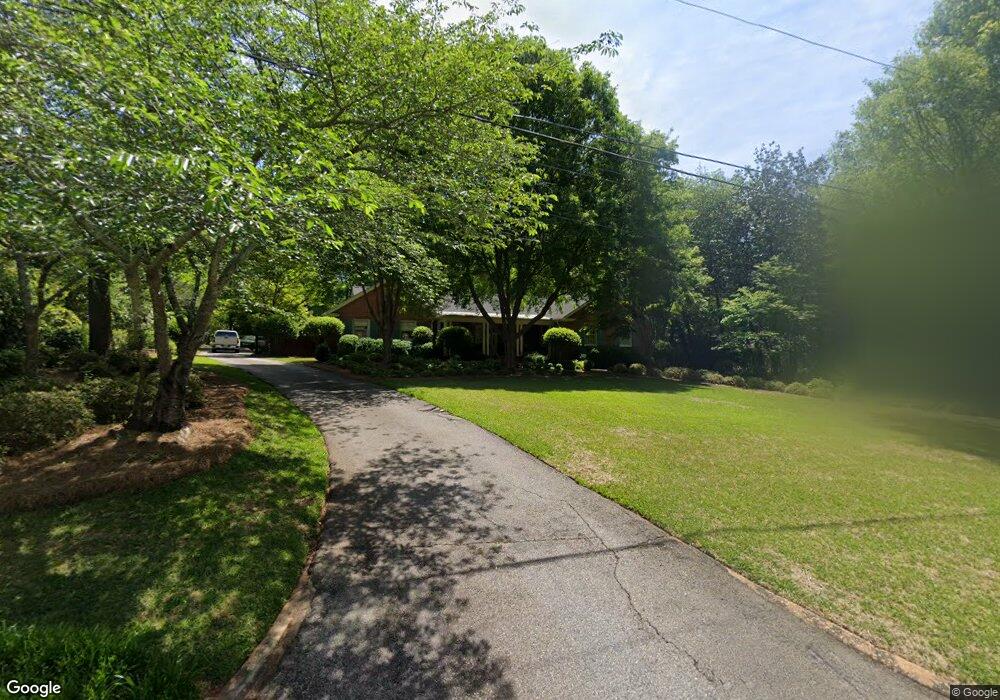
924 Mockingbird Ln Griffin, GA 30224
Spalding County NeighborhoodEstimated Value: $353,000 - $428,000
3
Beds
4
Baths
2,752
Sq Ft
$139/Sq Ft
Est. Value
About This Home
This home is located at 924 Mockingbird Ln, Griffin, GA 30224 and is currently estimated at $381,189, approximately $138 per square foot. 924 Mockingbird Ln is a home located in Spalding County with nearby schools including Crescent Road Elementary School, Rehoboth Road Middle School, and Spalding High School.
Ownership History
Date
Name
Owned For
Owner Type
Purchase Details
Closed on
Jul 30, 1999
Sold by
Fisher Jett M and Fisher Laurie E
Bought by
Luckie David M and Luckie Faye D
Current Estimated Value
Home Financials for this Owner
Home Financials are based on the most recent Mortgage that was taken out on this home.
Original Mortgage
$153,000
Outstanding Balance
$44,001
Interest Rate
7.66%
Mortgage Type
New Conventional
Estimated Equity
$337,188
Purchase Details
Closed on
Feb 17, 1992
Sold by
St George'S Episcopal Church
Bought by
Fisher Jett M and Fisher Laurie E
Purchase Details
Closed on
Jun 4, 1991
Sold by
Mustard Mustard C and Mustard Shirley S
Bought by
St George'S Episcopal Church
Purchase Details
Closed on
Jan 5, 1988
Sold by
St George'S Protestant Episcopal Church
Bought by
Mustard Mustard C and Mustard Shirley S
Purchase Details
Closed on
Dec 28, 1954
Bought by
St George'S Protestant Episcopal Church
Create a Home Valuation Report for This Property
The Home Valuation Report is an in-depth analysis detailing your home's value as well as a comparison with similar homes in the area
Home Values in the Area
Average Home Value in this Area
Purchase History
| Date | Buyer | Sale Price | Title Company |
|---|---|---|---|
| Luckie David M | $216,000 | -- | |
| Fisher Jett M | $140,000 | -- | |
| St George'S Episcopal Church | $137,100 | -- | |
| Mustard Mustard C | $132,500 | -- | |
| St George'S Protestant Episcopal Church | -- | -- |
Source: Public Records
Mortgage History
| Date | Status | Borrower | Loan Amount |
|---|---|---|---|
| Open | Luckie David M | $153,000 |
Source: Public Records
Tax History Compared to Growth
Tax History
| Year | Tax Paid | Tax Assessment Tax Assessment Total Assessment is a certain percentage of the fair market value that is determined by local assessors to be the total taxable value of land and additions on the property. | Land | Improvement |
|---|---|---|---|---|
| 2024 | $4,882 | $146,463 | $20,000 | $126,463 |
| 2023 | $4,992 | $146,463 | $20,000 | $126,463 |
| 2022 | $5,116 | $130,384 | $20,000 | $110,384 |
| 2021 | $4,562 | $116,505 | $20,000 | $96,505 |
| 2020 | $4,186 | $107,096 | $20,000 | $87,096 |
| 2019 | $3,247 | $82,135 | $20,000 | $62,135 |
| 2018 | $3,207 | $78,276 | $20,000 | $58,276 |
| 2017 | $3,184 | $79,394 | $20,000 | $59,394 |
| 2016 | $3,188 | $78,276 | $20,000 | $58,276 |
| 2015 | $3,241 | $78,276 | $20,000 | $58,276 |
| 2014 | $2,952 | $82,370 | $20,000 | $62,370 |
Source: Public Records
Map
Nearby Homes
- 1099 Pine Valley Rd
- 874 Crescent Ln Unit 52
- 850 Crescent Ln
- 859 Crescent Ln
- 861 Crescent Ln
- 405 Crescent Ct
- 1104 Maple Dr
- 336 Wynterhall Dr
- 311 Ashford Place
- 106 Summit Dr
- 922 Springer Dr
- 1541 Zebulon Rd & Unit 4 TRACTS 35 ACRES
- 202 Hillandale Dr
- 215 Pineywood Rd
- 201 Laramie Rd
- 1232 Buttermilk Ln
- 1234 Buttermilk Ln
- 1064 Cold Water Dr
- 941 Springer Dr
- 805 Hale Ave
- 922 Mockingbird Ln
- 928 Mockingbird Ln
- 918 Mockingbird Ln
- 930 Mockingbird Ln
- 1051 Pine Valley Rd
- 1105 Pine Valley Rd
- 914 Mockingbird Ln
- 923 Mockingbird Ln
- 917 Mockingbird Ln
- 927 Mockingbird Ln
- 932 Mockingbird Ln
- 915 Mockingbird Ln
- 912 Mockingbird Ln
- 499 Pine Valley Rd
- 931 Mockingbird Ln
- 1100 Pine Valley Rd
- 876 Crescent Ln
- 874 Crescent Ln
- 872 Crescent Ln Unit 53
- 872 Crescent Ln