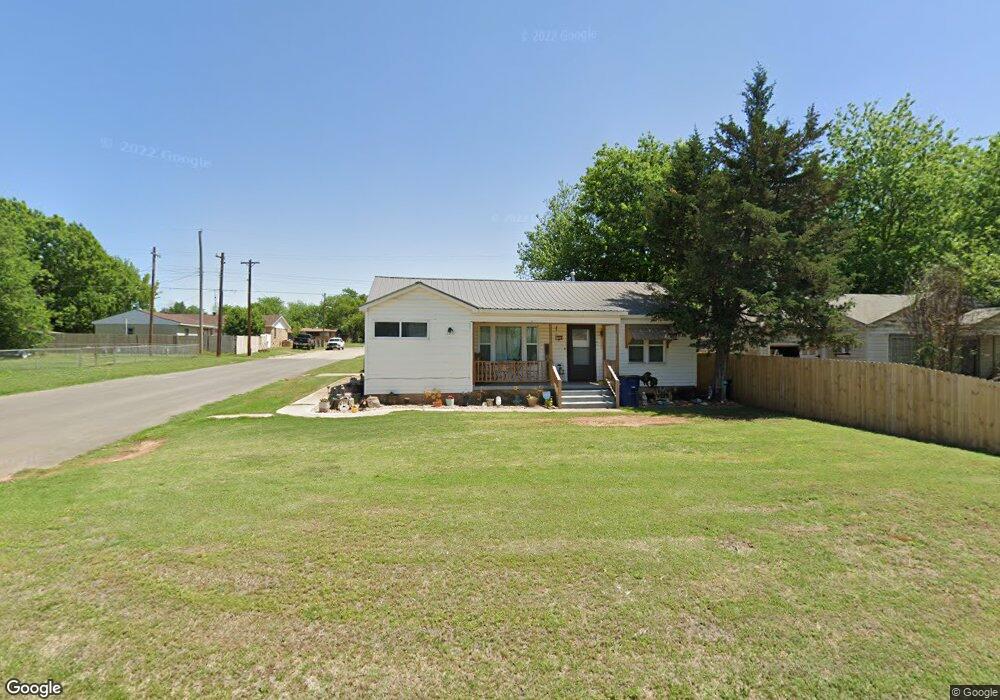
924 N C St Duncan, OK 73533
Estimated Value: $55,132 - $74,000
3
Beds
2
Baths
1,240
Sq Ft
$52/Sq Ft
Est. Value
About This Home
This home is located at 924 N C St, Duncan, OK 73533 and is currently estimated at $64,033, approximately $51 per square foot. 924 N C St is a home located in Stephens County with nearby schools including Woodrow Wilson Elementary School, Duncan Middle School, and Duncan High School.
Ownership History
Date
Name
Owned For
Owner Type
Purchase Details
Closed on
Dec 8, 2025
Sold by
Mckinnon Heather and Burleson Heather
Bought by
Burleson Jeremy
Current Estimated Value
Purchase Details
Closed on
Nov 10, 2010
Sold by
Mckinnon Heather and Burleson Heather
Bought by
Burleson Jeremy A and Burleson Heather R
Purchase Details
Closed on
Jan 22, 2010
Sold by
Riggs Paul D and Roseberry Sally L
Bought by
Mckinnon Heather
Home Financials for this Owner
Home Financials are based on the most recent Mortgage that was taken out on this home.
Original Mortgage
$52,019
Interest Rate
4.93%
Mortgage Type
FHA
Purchase Details
Closed on
May 16, 2008
Sold by
Boyd Thompson Elizabeth and Boyd Elizabeth Ann
Bought by
Riggs Sadie M and The Riggs Family Trust
Home Financials for this Owner
Home Financials are based on the most recent Mortgage that was taken out on this home.
Original Mortgage
$55,877
Interest Rate
5.89%
Mortgage Type
Purchase Money Mortgage
Purchase Details
Closed on
Aug 15, 1996
Sold by
Smallwood Smallwood W and Smallwood Virginia
Create a Home Valuation Report for This Property
The Home Valuation Report is an in-depth analysis detailing your home's value as well as a comparison with similar homes in the area
Home Values in the Area
Average Home Value in this Area
Purchase History
| Date | Buyer | Sale Price | Title Company |
|---|---|---|---|
| Burleson Jeremy | $53,000 | Stewart Title | |
| Burleson Jeremy A | -- | None Available | |
| Mckinnon Heather | $53,000 | Stewart Abstract & Title Of | |
| Riggs Sadie M | $55,000 | None Available | |
| -- | -- | -- |
Source: Public Records
Mortgage History
| Date | Status | Borrower | Loan Amount |
|---|---|---|---|
| Previous Owner | Mckinnon Heather | $52,019 | |
| Previous Owner | Riggs Sadie M | $55,877 |
Source: Public Records
Tax History Compared to Growth
Tax History
| Year | Tax Paid | Tax Assessment Tax Assessment Total Assessment is a certain percentage of the fair market value that is determined by local assessors to be the total taxable value of land and additions on the property. | Land | Improvement |
|---|---|---|---|---|
| 2025 | $236 | $3,800 | $356 | $3,444 |
| 2024 | $229 | $3,689 | $356 | $3,333 |
| 2023 | $229 | $3,689 | $356 | $3,333 |
| 2022 | $203 | $3,488 | $356 | $3,132 |
| 2021 | $203 | $3,386 | $356 | $3,030 |
| 2020 | $189 | $3,192 | $356 | $2,836 |
| 2019 | $182 | $3,099 | $356 | $2,743 |
| 2018 | $197 | $3,209 | $356 | $2,853 |
| 2017 | $276 | $4,213 | $356 | $3,857 |
| 2016 | $317 | $4,728 | $356 | $4,372 |
| 2015 | $428 | $4,728 | $356 | $4,372 |
| 2014 | $428 | $4,728 | $356 | $4,372 |
Source: Public Records
Map
Nearby Homes