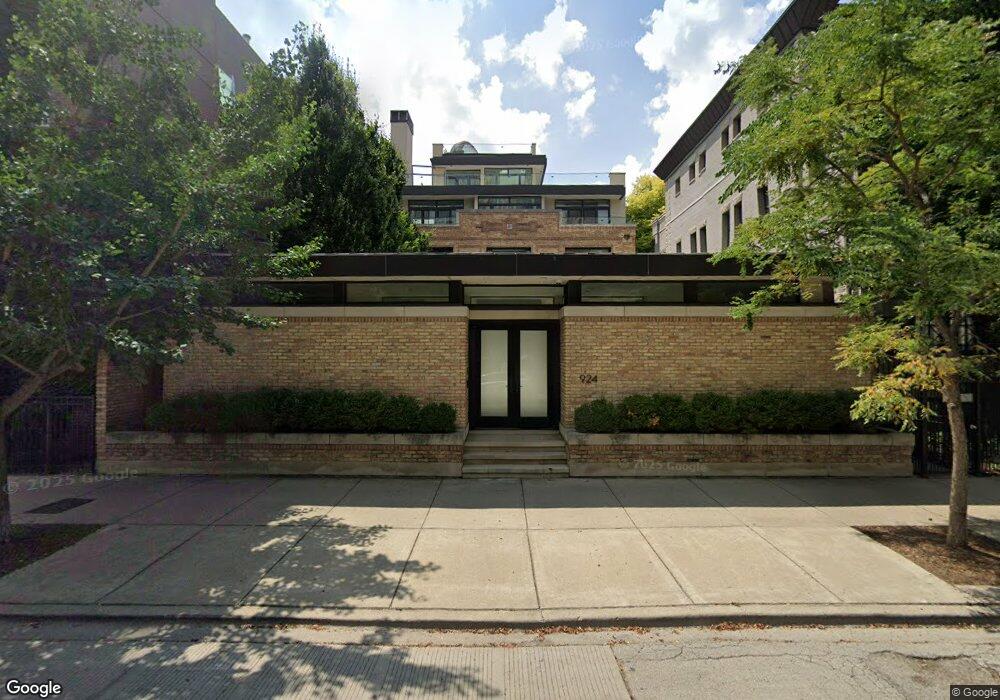
924 N Clark St Chicago, IL 60610
River North NeighborhoodEstimated Value: $3,936,000 - $3,947,432
6
Beds
8
Baths
9,773
Sq Ft
$403/Sq Ft
Est. Value
About This Home
This home is located at 924 N Clark St, Chicago, IL 60610 and is currently estimated at $3,941,716, approximately $403 per square foot. 924 N Clark St is a home located in Cook County with nearby schools including Ogden Elementary School, Wells Community Academy High School, and Frances Xavier Warde School.
Ownership History
Date
Name
Owned For
Owner Type
Purchase Details
Closed on
Jul 5, 2018
Sold by
Celman Bruce and Celman Michele
Bought by
Chicago Title Land Trust Company and Trust Number 8002378325
Current Estimated Value
Purchase Details
Closed on
Feb 22, 2008
Sold by
Moss Meryl Lyn
Bought by
Gelman Bruce and Gelman Michele
Home Financials for this Owner
Home Financials are based on the most recent Mortgage that was taken out on this home.
Original Mortgage
$4,725,000
Interest Rate
5.75%
Mortgage Type
Construction
Purchase Details
Closed on
Feb 19, 2008
Sold by
Culver Partners Lp
Bought by
Moss Meryl Lyn and Sydney K Culver & Associates Inc
Home Financials for this Owner
Home Financials are based on the most recent Mortgage that was taken out on this home.
Original Mortgage
$4,725,000
Interest Rate
5.75%
Mortgage Type
Construction
Purchase Details
Closed on
Feb 9, 2001
Sold by
Culver Sydney K
Bought by
Culver Partners Lp
Create a Home Valuation Report for This Property
The Home Valuation Report is an in-depth analysis detailing your home's value as well as a comparison with similar homes in the area
Home Values in the Area
Average Home Value in this Area
Purchase History
| Date | Buyer | Sale Price | Title Company |
|---|---|---|---|
| Chicago Title Land Trust Company | -- | Chicago Title Land Trust Com | |
| Gelman Bruce | $3,750,000 | None Available | |
| Moss Meryl Lyn | -- | None Available | |
| Culver Partners Lp | -- | -- |
Source: Public Records
Mortgage History
| Date | Status | Borrower | Loan Amount |
|---|---|---|---|
| Previous Owner | Gelman Bruce | $4,725,000 |
Source: Public Records
Tax History Compared to Growth
Tax History
| Year | Tax Paid | Tax Assessment Tax Assessment Total Assessment is a certain percentage of the fair market value that is determined by local assessors to be the total taxable value of land and additions on the property. | Land | Improvement |
|---|---|---|---|---|
| 2024 | $144,341 | $700,000 | $209,499 | $490,501 |
| 2023 | $140,709 | $684,110 | $196,300 | $487,810 |
| 2022 | $140,709 | $684,110 | $196,300 | $487,810 |
| 2021 | $137,568 | $684,110 | $196,300 | $487,810 |
| 2020 | $162,660 | $730,173 | $137,410 | $592,763 |
| 2019 | $159,458 | $793,667 | $137,410 | $656,257 |
| 2018 | $192,529 | $978,102 | $137,410 | $840,692 |
| 2017 | $198,070 | $923,475 | $109,928 | $813,547 |
| 2016 | $184,461 | $923,475 | $109,928 | $813,547 |
| 2015 | $168,742 | $923,475 | $109,928 | $813,547 |
| 2014 | $63,834 | $346,614 | $94,224 | $252,390 |
| 2013 | $62,562 | $346,614 | $94,224 | $252,390 |
Source: Public Records
Map
Nearby Homes
- 111 W Maple St Unit 1805
- 915 N Dearborn St
- 30 W Oak St Unit 5E
- 55 W Delaware Place Unit 1011
- 55 W Delaware Place Unit 221
- 55 W Delaware Place Unit 513
- 55 W Delaware Place Unit 608
- 33 W Delaware Place Unit 10B
- 33 W Delaware Place Unit 9D
- 33 W Delaware Place Unit 13A
- 33 W Delaware Place Unit 19H
- 9 W Walton St Unit 2802
- 1000 N State St Unit 14
- 1122 N Dearborn St Unit 18I
- 1122 N Dearborn St Unit P77
- 1030 N State St Unit 33GH
- 1030 N State St Unit 51J
- 1030 N State St Unit 38GH
- 1030 N State St Unit 21K
- 1030 N State St Unit 31K
- 924 N Clark St
- 104 W Delaware Place
- 108 W Delaware Place
- 100 W Delaware Place
- 112 W Delaware Place
- 120 W Delaware Place Unit 4E
- 120 W Delaware Place Unit 3E
- 120 W Delaware Place Unit 1E
- 120 W Delaware Place Unit 2E
- 930 N Clark St Unit J
- 930 N Clark St Unit L
- 930 N Clark St Unit E
- 930 N Clark St Unit 25C
- 930 N Clark St Unit 28D
- 930 N Clark St Unit 31C
- 930 N Clark St Unit K
- 930 N Clark St Unit I
- 930 N Clark St Unit F
- 930 N Clark St
- 930 N Clark St Unit C