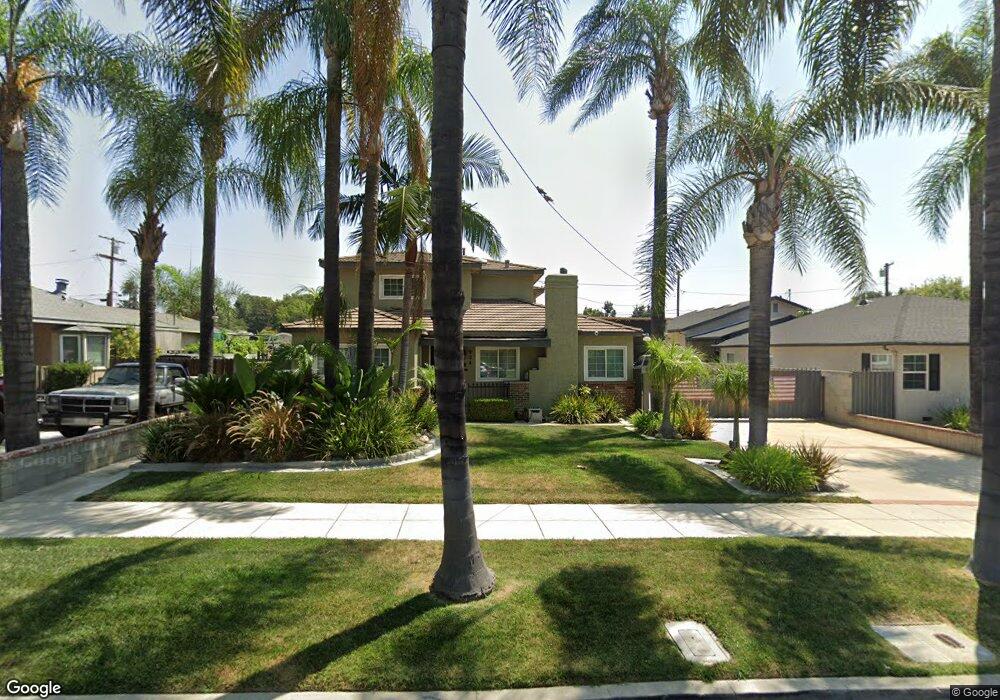
924 N Palm Ave Ontario, CA 91762
Downtown Ontario NeighborhoodEstimated Value: $753,000 - $853,000
5
Beds
3
Baths
2,388
Sq Ft
$336/Sq Ft
Est. Value
About This Home
This home is located at 924 N Palm Ave, Ontario, CA 91762 and is currently estimated at $802,852, approximately $336 per square foot. 924 N Palm Ave is a home located in San Bernardino County with nearby schools including Hawthorne Elementary, Vina Danks Middle, and Chaffey High School.
Ownership History
Date
Name
Owned For
Owner Type
Purchase Details
Closed on
Mar 3, 2012
Sold by
Miller Roy D and Miller Bertha M
Bought by
Miller Roy D and Miller Bertha M
Current Estimated Value
Purchase Details
Closed on
Apr 8, 1996
Sold by
Wolfe William H and Wolfe Robert L
Bought by
Miller Roy and Miller Bertha
Home Financials for this Owner
Home Financials are based on the most recent Mortgage that was taken out on this home.
Original Mortgage
$84,000
Outstanding Balance
$3,916
Interest Rate
7.25%
Estimated Equity
$798,936
Create a Home Valuation Report for This Property
The Home Valuation Report is an in-depth analysis detailing your home's value as well as a comparison with similar homes in the area
Home Values in the Area
Average Home Value in this Area
Purchase History
| Date | Buyer | Sale Price | Title Company |
|---|---|---|---|
| Miller Roy D | -- | None Available | |
| Miller Roy | $105,000 | First American Title Ins Co |
Source: Public Records
Mortgage History
| Date | Status | Borrower | Loan Amount |
|---|---|---|---|
| Open | Miller Roy | $84,000 |
Source: Public Records
Tax History Compared to Growth
Tax History
| Year | Tax Paid | Tax Assessment Tax Assessment Total Assessment is a certain percentage of the fair market value that is determined by local assessors to be the total taxable value of land and additions on the property. | Land | Improvement |
|---|---|---|---|---|
| 2025 | $1,170 | $114,335 | $14,676 | $99,659 |
| 2024 | $1,170 | $112,093 | $14,388 | $97,705 |
| 2023 | $1,136 | $109,895 | $14,106 | $95,789 |
| 2022 | $1,119 | $107,740 | $13,829 | $93,911 |
| 2021 | $1,111 | $105,628 | $13,558 | $92,070 |
| 2020 | $1,090 | $104,545 | $13,419 | $91,126 |
| 2019 | $1,080 | $102,495 | $13,156 | $89,339 |
| 2018 | $1,063 | $100,485 | $12,898 | $87,587 |
| 2017 | $1,024 | $98,515 | $12,645 | $85,870 |
| 2016 | $983 | $96,583 | $12,397 | $84,186 |
| 2015 | $975 | $95,132 | $12,211 | $82,921 |
| 2014 | $943 | $93,269 | $11,972 | $81,297 |
Source: Public Records
Map
Nearby Homes