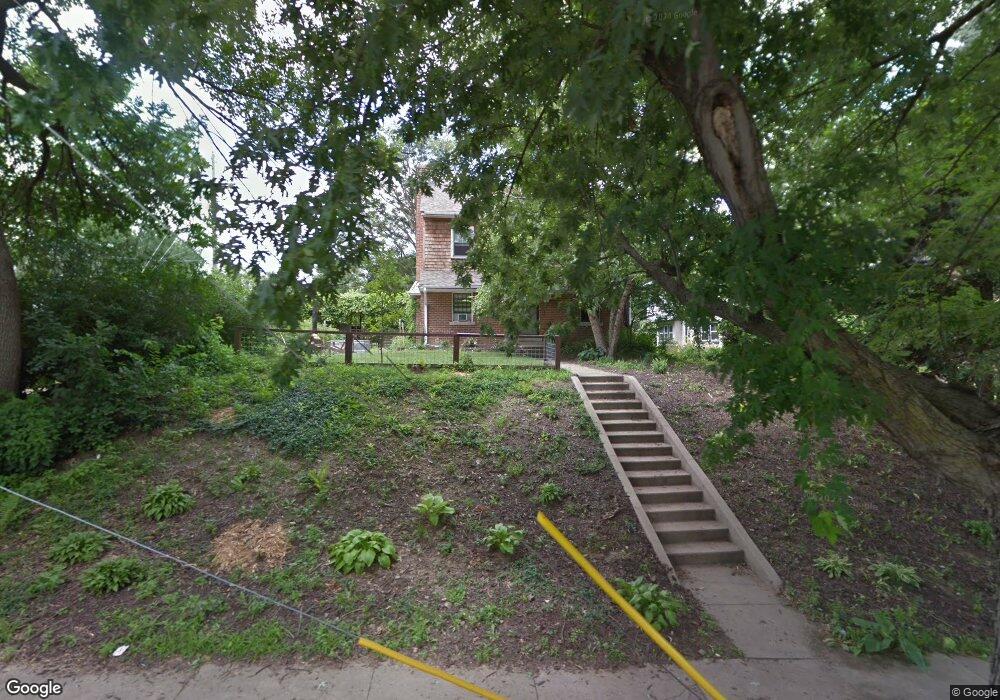
924 S 36th St Omaha, NE 68105
Leavenworth NeighborhoodEstimated Value: $279,000 - $347,000
3
Beds
2
Baths
1,740
Sq Ft
$179/Sq Ft
Est. Value
About This Home
This home is located at 924 S 36th St, Omaha, NE 68105 and is currently estimated at $311,471, approximately $179 per square foot. 924 S 36th St is a home located in Douglas County with nearby schools including Field Club Elementary School, Norris Middle School, and Central High School.
Ownership History
Date
Name
Owned For
Owner Type
Purchase Details
Closed on
Oct 3, 2016
Sold by
Hansen Brian C and Damewood Dana
Bought by
Hansen Brian C and Damewood Dana
Current Estimated Value
Home Financials for this Owner
Home Financials are based on the most recent Mortgage that was taken out on this home.
Original Mortgage
$116,000
Outstanding Balance
$54,306
Interest Rate
3.43%
Mortgage Type
New Conventional
Estimated Equity
$257,165
Purchase Details
Closed on
May 6, 2009
Sold by
Fitzpatrick Molly K and Andrews Richard L
Bought by
Hansen Brian
Home Financials for this Owner
Home Financials are based on the most recent Mortgage that was taken out on this home.
Original Mortgage
$120,828
Interest Rate
4.77%
Mortgage Type
FHA
Purchase Details
Closed on
Dec 17, 2007
Sold by
Behrens Kent C
Bought by
Fitzpatrick Molly K
Create a Home Valuation Report for This Property
The Home Valuation Report is an in-depth analysis detailing your home's value as well as a comparison with similar homes in the area
Home Values in the Area
Average Home Value in this Area
Purchase History
| Date | Buyer | Sale Price | Title Company |
|---|---|---|---|
| Hansen Brian C | -- | Dri Title & Escrow | |
| Hansen Brian | $125,000 | Nlta | |
| Fitzpatrick Molly K | $139,000 | -- |
Source: Public Records
Mortgage History
| Date | Status | Borrower | Loan Amount |
|---|---|---|---|
| Open | Hansen Brian C | $116,000 | |
| Closed | Hansen Brian | $120,828 |
Source: Public Records
Tax History Compared to Growth
Tax History
| Year | Tax Paid | Tax Assessment Tax Assessment Total Assessment is a certain percentage of the fair market value that is determined by local assessors to be the total taxable value of land and additions on the property. | Land | Improvement |
|---|---|---|---|---|
| 2024 | $4,481 | $256,300 | $25,900 | $230,400 |
| 2023 | $4,481 | $212,400 | $25,900 | $186,500 |
| 2022 | $4,399 | $206,100 | $19,600 | $186,500 |
| 2021 | $3,389 | $160,100 | $19,600 | $140,500 |
| 2020 | $3,428 | $160,100 | $19,600 | $140,500 |
| 2019 | $2,794 | $130,100 | $19,600 | $110,500 |
| 2018 | $2,911 | $135,400 | $19,600 | $115,800 |
| 2017 | $2,926 | $135,400 | $19,600 | $115,800 |
| 2016 | $2,832 | $132,000 | $16,200 | $115,800 |
| 2015 | $2,795 | $132,000 | $16,200 | $115,800 |
| 2014 | $2,795 | $132,000 | $16,200 | $115,800 |
Source: Public Records
Map
Nearby Homes