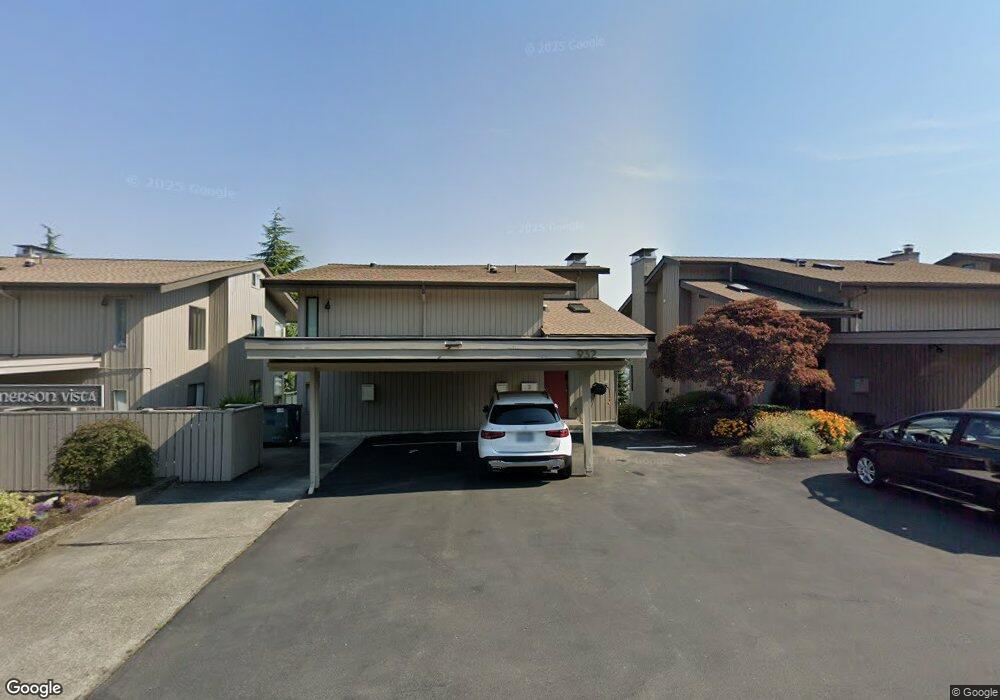
924 W Emerson St Unit 936C Seattle, WA 98119
North Queen Anne NeighborhoodEstimated Value: $542,000 - $606,000
2
Beds
2
Baths
1,175
Sq Ft
$494/Sq Ft
Est. Value
About This Home
This home is located at 924 W Emerson St Unit 936C, Seattle, WA 98119 and is currently estimated at $580,032, approximately $493 per square foot. 924 W Emerson St Unit 936C is a home located in King County with nearby schools including Coe Elementary School, Mcclure Middle School, and Lincoln High School.
Ownership History
Date
Name
Owned For
Owner Type
Purchase Details
Closed on
Aug 4, 2014
Sold by
Tinney Brenda J
Bought by
Ioannides Nektarios
Current Estimated Value
Purchase Details
Closed on
May 20, 2005
Sold by
Kosar David L
Bought by
Tinney Brenda J
Home Financials for this Owner
Home Financials are based on the most recent Mortgage that was taken out on this home.
Original Mortgage
$252,000
Interest Rate
6.12%
Purchase Details
Closed on
Aug 10, 1999
Sold by
Beseda Anton A and Beseda Berta
Bought by
Kosar David L
Home Financials for this Owner
Home Financials are based on the most recent Mortgage that was taken out on this home.
Original Mortgage
$147,160
Interest Rate
7.7%
Create a Home Valuation Report for This Property
The Home Valuation Report is an in-depth analysis detailing your home's value as well as a comparison with similar homes in the area
Home Values in the Area
Average Home Value in this Area
Purchase History
| Date | Buyer | Sale Price | Title Company |
|---|---|---|---|
| Ioannides Nektarios | $305,000 | Rainier Title | |
| Tinney Brenda J | $315,000 | Pacific Nw Tit | |
| Kosar David L | $183,950 | Chicago Title |
Source: Public Records
Mortgage History
| Date | Status | Borrower | Loan Amount |
|---|---|---|---|
| Previous Owner | Tinney Brenda J | $252,000 | |
| Previous Owner | Kosar David L | $147,160 | |
| Closed | Tinney Brenda J | $63,000 |
Source: Public Records
Tax History Compared to Growth
Tax History
| Year | Tax Paid | Tax Assessment Tax Assessment Total Assessment is a certain percentage of the fair market value that is determined by local assessors to be the total taxable value of land and additions on the property. | Land | Improvement |
|---|---|---|---|---|
| 2024 | $5,099 | $524,000 | $343,200 | $180,800 |
| 2023 | $4,287 | $500,000 | $343,200 | $156,800 |
| 2022 | $4,742 | $498,000 | $265,900 | $232,100 |
| 2021 | $4,452 | $511,000 | $265,900 | $245,100 |
| 2020 | $4,622 | $455,000 | $265,900 | $189,100 |
| 2018 | $3,941 | $510,000 | $240,200 | $269,800 |
| 2017 | $3,387 | $394,000 | $180,100 | $213,900 |
| 2016 | $3,276 | $349,000 | $145,800 | $203,200 |
| 2015 | $2,275 | $330,000 | $145,800 | $184,200 |
| 2014 | -- | $231,000 | $128,700 | $102,300 |
| 2013 | -- | $202,000 | $120,100 | $81,900 |
Source: Public Records
Map
Nearby Homes
- 918 W Emerson St
- 3814 11th Ave W Unit 23
- 664 W Emerson St Unit A
- 1080 W Ewing Place Unit P
- 1080 W Ewing St Unit E-2
- 633 W Emerson St
- 627 B W Emerson St
- 631 W Emerson St
- 625 W Emerson St
- 608 W Emerson St
- 617 W Emerson St
- 3437 14th Ave W Unit A
- 3252 13th Ave W
- 605 W Emerson St
- 651 W Bertona St
- 650 W Cremona St
- 3246 14th Ave W
- 360 W Ewing St Unit C26
- 4020 6th Ave NW
- 730 W Etruria St
- 924 W Emerson St Unit B
- 928 W Emerson St Unit C
- 936 W Emerson St Unit A
- 936 W Emerson St Unit 936-C
- 924 W Emerson St Unit 5940C
- 924 W Emerson St Unit 5940A
- 924 W Emerson St Unit 3932A
- 924 W Emerson St Unit 924A
- 924 W Emerson St Unit 5940B
- 924 W Emerson St Unit 3932B
- 924 W Emerson St Unit 4936C
- 924 W Emerson St Unit 4936B
- 924 W Emerson St Unit 4936A
- 924 W Emerson St Unit 3932C
- 924 W Emerson St Unit 2928C
- 924 W Emerson St Unit 2928B
- 924 W Emerson St Unit 2928A
- 924 W Emerson St Unit 924B
- 932 W Emerson St Unit A
- 932 W Emerson St Unit B