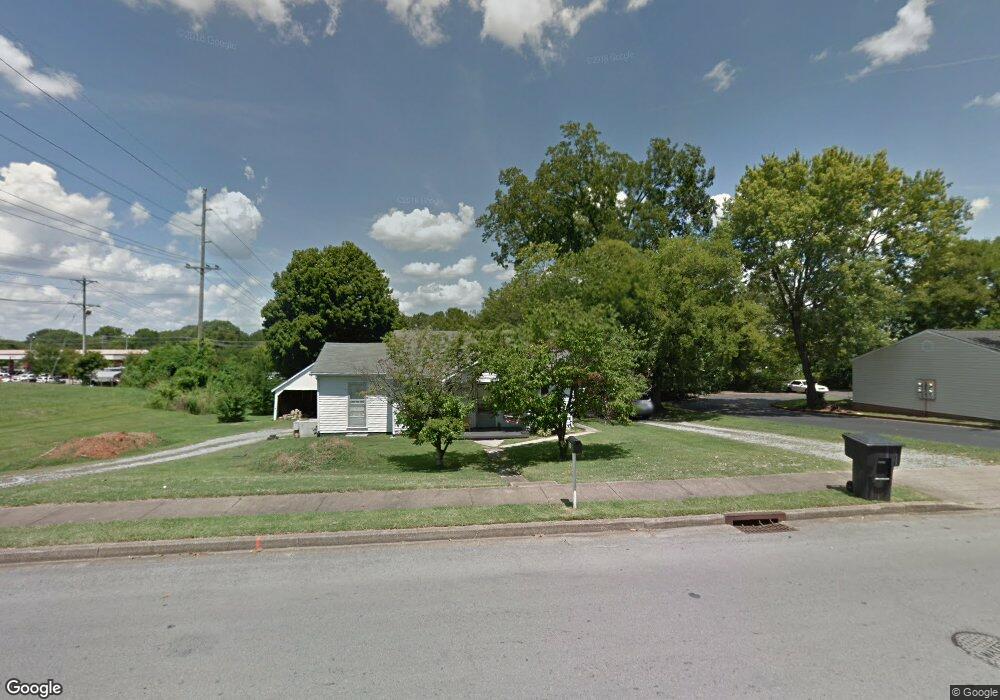
924 W Main St Murfreesboro, TN 37129
Estimated Value: $304,000 - $357,560
--
Bed
1
Bath
1,378
Sq Ft
$243/Sq Ft
Est. Value
About This Home
This home is located at 924 W Main St, Murfreesboro, TN 37129 and is currently estimated at $334,890, approximately $243 per square foot. 924 W Main St is a home with nearby schools including Mitchell-Neilson Elementary, Rockvale Middle School, and Rockvale High School.
Ownership History
Date
Name
Owned For
Owner Type
Purchase Details
Closed on
Aug 14, 2016
Sold by
Honeycutt Kenneth D and Honeycutt James R
Bought by
Honeycutt Benjamin
Current Estimated Value
Home Financials for this Owner
Home Financials are based on the most recent Mortgage that was taken out on this home.
Original Mortgage
$101,134
Outstanding Balance
$80,510
Interest Rate
3.41%
Mortgage Type
FHA
Estimated Equity
$254,380
Purchase Details
Closed on
Sep 14, 2005
Sold by
Honeycutt Walton D
Bought by
Honeycutt Walton D and Honeycutt Margaret
Create a Home Valuation Report for This Property
The Home Valuation Report is an in-depth analysis detailing your home's value as well as a comparison with similar homes in the area
Home Values in the Area
Average Home Value in this Area
Purchase History
| Date | Buyer | Sale Price | Title Company |
|---|---|---|---|
| Honeycutt Benjamin | $103,000 | None Available | |
| Honeycutt Walton D | -- | -- |
Source: Public Records
Mortgage History
| Date | Status | Borrower | Loan Amount |
|---|---|---|---|
| Open | Honeycutt Benjamin | $101,134 |
Source: Public Records
Tax History Compared to Growth
Tax History
| Year | Tax Paid | Tax Assessment Tax Assessment Total Assessment is a certain percentage of the fair market value that is determined by local assessors to be the total taxable value of land and additions on the property. | Land | Improvement |
|---|---|---|---|---|
| 2025 | $1,874 | $66,275 | $18,750 | $47,525 |
| 2024 | $1,874 | $66,275 | $18,750 | $47,525 |
| 2023 | $1,243 | $66,275 | $18,750 | $47,525 |
| 2022 | $1,006 | $53,725 | $13,750 | $39,975 |
| 2021 | $714 | $32,175 | $7,500 | $24,675 |
| 2020 | $714 | $32,175 | $7,500 | $24,675 |
| 2019 | $714 | $32,175 | $7,500 | $24,675 |
| 2018 | $980 | $32,175 | $0 | $0 |
| 2017 | $813 | $20,925 | $0 | $0 |
| 2016 | $813 | $20,925 | $0 | $0 |
| 2015 | $813 | $20,925 | $0 | $0 |
| 2014 | $520 | $20,925 | $0 | $0 |
| 2013 | -- | $16,250 | $0 | $0 |
Source: Public Records
Map
Nearby Homes
- 105 Battle Ave
- 728 Old Salem Rd
- 513 N Maple St
- 1006 Jones Blvd
- 412 N Church St
- 503 N Spring St
- 225 N Academy St
- 515 N Spring St
- 1007 Grantland Ave
- 717 N Church St
- 422 N Academy St
- 608 Lynn St
- 1120 White Blvd
- 401 E Main St
- 1022 Poplar Ave
- 814 N Church St
- 904 N Maple St
- 420 E State St
- 906 N Maple St
- 1107 Owen Layne Dr
- 911 W Main St
- 104 February St
- 907 W Main St
- 1006 W Main St Unit 8
- 905 W Main St
- 905 W Main St Unit 905
- 107 February St
- 903 W Main St
- 901 W Main St Unit 905
- 110 February St
- 4 New Salem Hwy
- 1 New Salem
- 116 February St
- 109 January St
- 107 January St
- 1104 W Main St
- 103 January St
- 111 January St
- 126 February St
- 115 January St