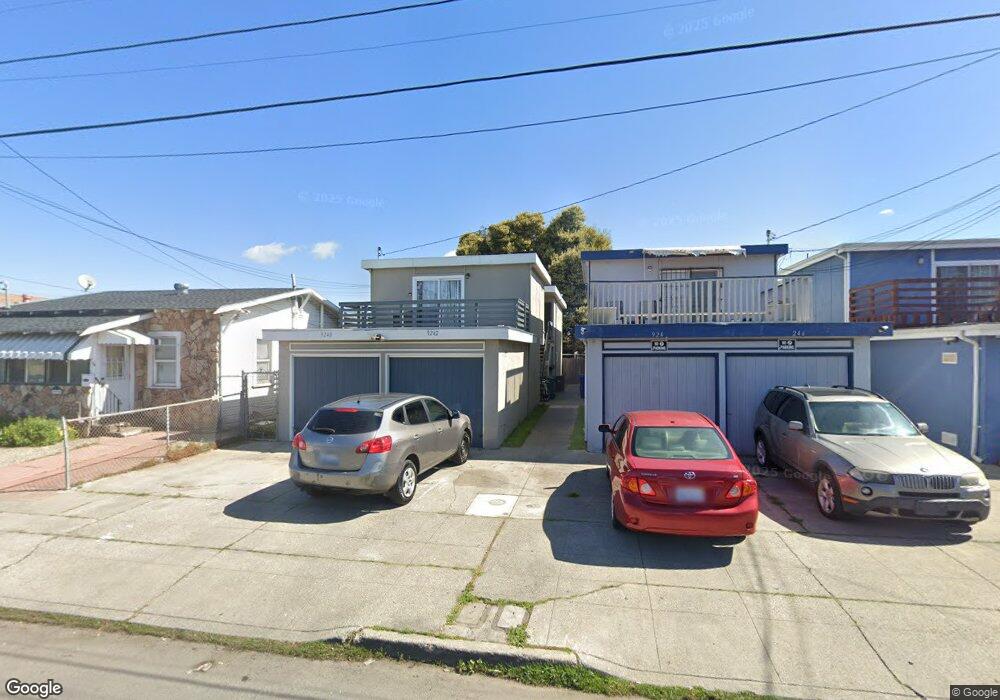
9240 C St Oakland, CA 94603
Elmhurst Park NeighborhoodEstimated Value: $679,000 - $925,000
6
Beds
2
Baths
2,144
Sq Ft
$361/Sq Ft
Est. Value
About This Home
This home is located at 9240 C St, Oakland, CA 94603 and is currently estimated at $773,534, approximately $360 per square foot. 9240 C St is a home located in Alameda County with nearby schools including New Highland Academy, Acorn Woodland Elementary School, and Encompass Academy Elementary.
Ownership History
Date
Name
Owned For
Owner Type
Purchase Details
Closed on
Feb 13, 2018
Sold by
Vanle Thang Van and Vu Thuc Oanh Thi
Bought by
Huynh Hoa X and Doan Tuyet T
Current Estimated Value
Home Financials for this Owner
Home Financials are based on the most recent Mortgage that was taken out on this home.
Original Mortgage
$406,000
Outstanding Balance
$231,246
Interest Rate
4.04%
Mortgage Type
New Conventional
Estimated Equity
$542,288
Purchase Details
Closed on
Oct 8, 2001
Sold by
Vanle Thang and Tu Thuc Oanh Thi
Bought by
Vanle Thang and Vu Thuc Oanh Thi
Home Financials for this Owner
Home Financials are based on the most recent Mortgage that was taken out on this home.
Original Mortgage
$196,700
Interest Rate
6.91%
Purchase Details
Closed on
May 17, 1995
Sold by
Vanle Thang Van and Vu Thuc Oanh Thi
Bought by
Vanle Thang Van and Vu Thuc Oanh Thi
Create a Home Valuation Report for This Property
The Home Valuation Report is an in-depth analysis detailing your home's value as well as a comparison with similar homes in the area
Home Values in the Area
Average Home Value in this Area
Purchase History
| Date | Buyer | Sale Price | Title Company |
|---|---|---|---|
| Huynh Hoa X | $625,000 | Chicago Title Company | |
| Vanle Thang | -- | North American Title Co | |
| Vanle Thang Van | -- | -- |
Source: Public Records
Mortgage History
| Date | Status | Borrower | Loan Amount |
|---|---|---|---|
| Open | Huynh Hoa X | $406,000 | |
| Previous Owner | Vanle Thang | $196,700 |
Source: Public Records
Tax History
| Year | Tax Paid | Tax Assessment Tax Assessment Total Assessment is a certain percentage of the fair market value that is determined by local assessors to be the total taxable value of land and additions on the property. | Land | Improvement |
|---|---|---|---|---|
| 2025 | $11,225 | $711,130 | $213,339 | $497,791 |
| 2024 | $11,225 | $697,187 | $209,156 | $488,031 |
| 2023 | $11,742 | $683,518 | $205,055 | $478,463 |
| 2022 | $11,365 | $670,118 | $201,035 | $469,083 |
| 2021 | $10,819 | $656,980 | $197,094 | $459,886 |
| 2020 | $10,698 | $650,250 | $195,075 | $455,175 |
| 2019 | $10,264 | $637,500 | $191,250 | $446,250 |
| 2018 | $4,380 | $210,196 | $63,059 | $147,137 |
| 2017 | $4,165 | $206,075 | $61,822 | $144,253 |
| 2016 | $3,964 | $202,034 | $60,610 | $141,424 |
| 2015 | $3,937 | $199,000 | $59,700 | $139,300 |
| 2014 | $3,937 | $195,103 | $58,531 | $136,572 |
Source: Public Records
Map
Nearby Homes
Your Personal Tour Guide
Ask me questions while you tour the home.