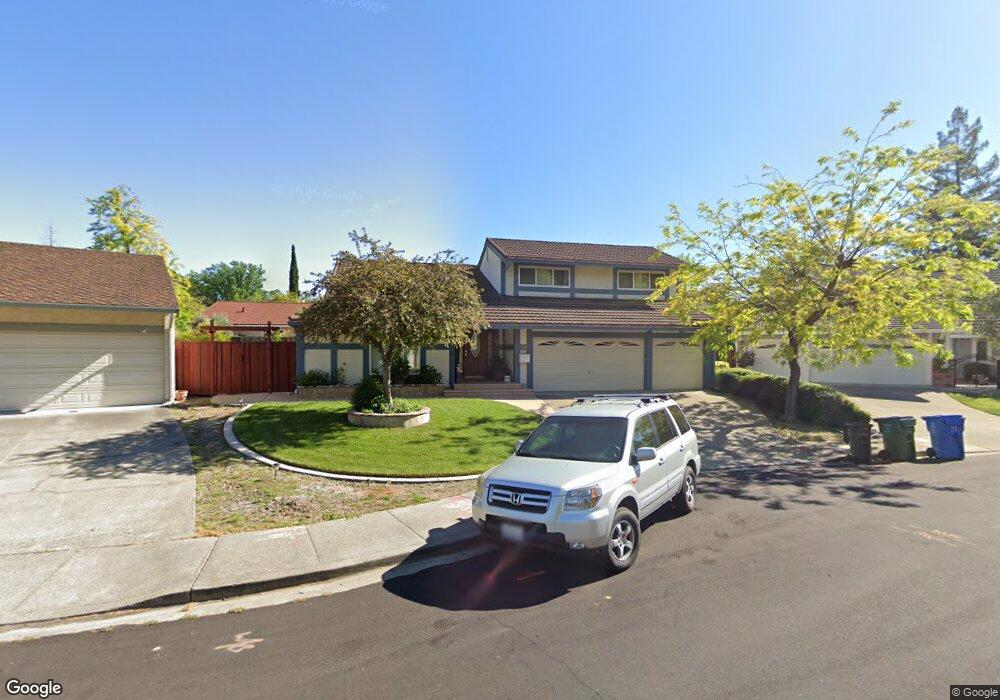
925 Avondale Ct Walnut Creek, CA 94596
Estimated Value: $1,611,000 - $1,751,000
4
Beds
3
Baths
2,284
Sq Ft
$740/Sq Ft
Est. Value
About This Home
This home is located at 925 Avondale Ct, Walnut Creek, CA 94596 and is currently estimated at $1,691,079, approximately $740 per square foot. 925 Avondale Ct is a home located in Contra Costa County with nearby schools including Murwood Elementary School, Walnut Creek Intermediate School, and Las Lomas High School.
Ownership History
Date
Name
Owned For
Owner Type
Purchase Details
Closed on
Aug 30, 2017
Sold by
Younger Scott W and Younger Maxine P
Bought by
Younger Scott W and Younger Maxine P
Current Estimated Value
Purchase Details
Closed on
Sep 17, 2003
Sold by
Frech Charles E
Bought by
Younger Scott W and Younger Maxine P
Home Financials for this Owner
Home Financials are based on the most recent Mortgage that was taken out on this home.
Original Mortgage
$521,950
Outstanding Balance
$217,103
Interest Rate
4.75%
Mortgage Type
Purchase Money Mortgage
Estimated Equity
$1,473,976
Purchase Details
Closed on
May 6, 2002
Sold by
Frech Charles E
Bought by
Frech Charles E
Purchase Details
Closed on
Mar 16, 1998
Sold by
Frech Leslie C
Bought by
Frech Charles E
Home Financials for this Owner
Home Financials are based on the most recent Mortgage that was taken out on this home.
Original Mortgage
$270,000
Interest Rate
7.02%
Mortgage Type
Purchase Money Mortgage
Create a Home Valuation Report for This Property
The Home Valuation Report is an in-depth analysis detailing your home's value as well as a comparison with similar homes in the area
Home Values in the Area
Average Home Value in this Area
Purchase History
| Date | Buyer | Sale Price | Title Company |
|---|---|---|---|
| Younger Scott W | -- | None Available | |
| Younger Scott W | $652,500 | Old Republic Title | |
| Frech Charles E | -- | -- | |
| Frech Charles E | -- | Placer Title Company |
Source: Public Records
Mortgage History
| Date | Status | Borrower | Loan Amount |
|---|---|---|---|
| Open | Younger Scott W | $521,950 | |
| Previous Owner | Frech Charles E | $270,000 |
Source: Public Records
Tax History Compared to Growth
Tax History
| Year | Tax Paid | Tax Assessment Tax Assessment Total Assessment is a certain percentage of the fair market value that is determined by local assessors to be the total taxable value of land and additions on the property. | Land | Improvement |
|---|---|---|---|---|
| 2025 | $11,178 | $926,282 | $597,146 | $329,136 |
| 2024 | $11,178 | $908,121 | $585,438 | $322,683 |
| 2023 | $10,913 | $890,315 | $573,959 | $316,356 |
| 2022 | $10,677 | $872,858 | $562,705 | $310,153 |
| 2021 | $10,389 | $855,744 | $551,672 | $304,072 |
| 2019 | $10,174 | $830,364 | $535,310 | $295,054 |
| 2018 | $9,831 | $814,083 | $524,814 | $289,269 |
| 2017 | $9,650 | $798,122 | $514,524 | $283,598 |
| 2016 | $9,469 | $782,474 | $504,436 | $278,038 |
| 2015 | $9,254 | $770,721 | $496,859 | $273,862 |
| 2014 | $9,147 | $755,625 | $487,127 | $268,498 |
Source: Public Records
Map
Nearby Homes
- 1092 Hillendale Ct
- 421 Twin Oaks Ln
- 2129 Youngs Ct
- 32 Pacer Place
- 31 Arabian Ct
- 1096 Mountain View Blvd
- 628 Sugarloaf Ct
- 172 Rudgear Dr
- 1305 Chesterton Way
- 189 Rudgear Dr
- 2409 Lavender Dr
- 2128 San Miguel Dr
- 1080 Scots Ln
- 1101 Scots Ln
- 4 Brookdale Ct
- 2673 Velvet Way
- 1555 Pebblebrook Ct
- 1310 Creekside Dr Unit 303
- 1310 Creekside Dr Unit 103
- 2101 Hillview Dr
- 915 Avondale Ct
- 935 Avondale Ct
- 922 Reddington Ct
- 932 Reddington Ct
- 952 Reddington Ct
- 912 Reddington Ct
- 905 Avondale Ct
- 916 Avondale Ct
- 936 Avondale Ct
- 906 Avondale Ct
- 903 Reddington Ct
- 930 Palmer Rd
- 920 Palmer Rd
- 1000 Knightwood Ct
- 943 Reddington Ct
- 933 Reddington Ct
- 905 Palmer Rd
- 125 Kingsdale Dr
- 923 Reddington Ct
- 913 Reddington Ct